Planet Generation

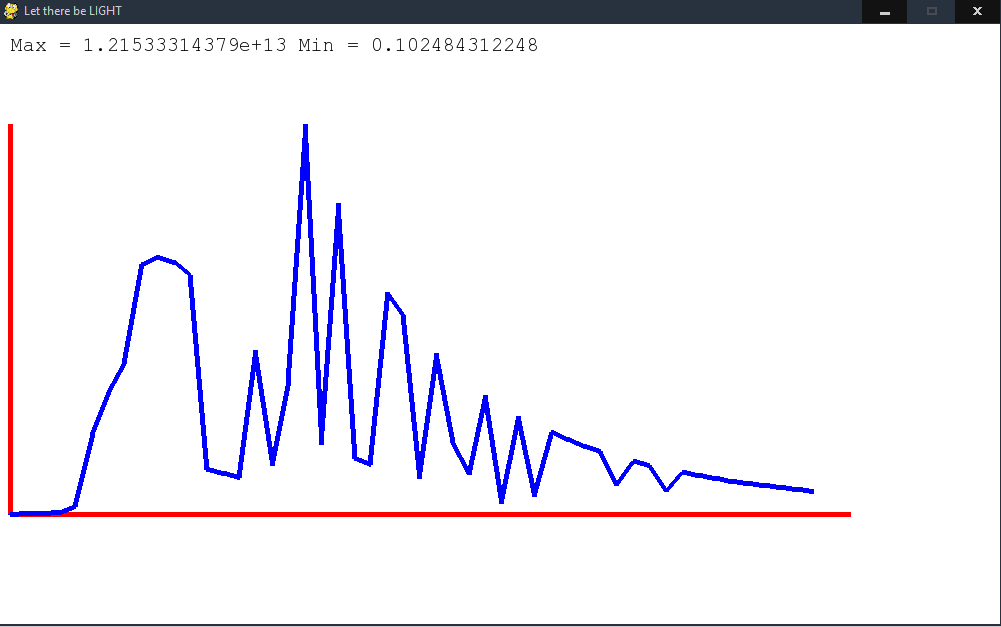
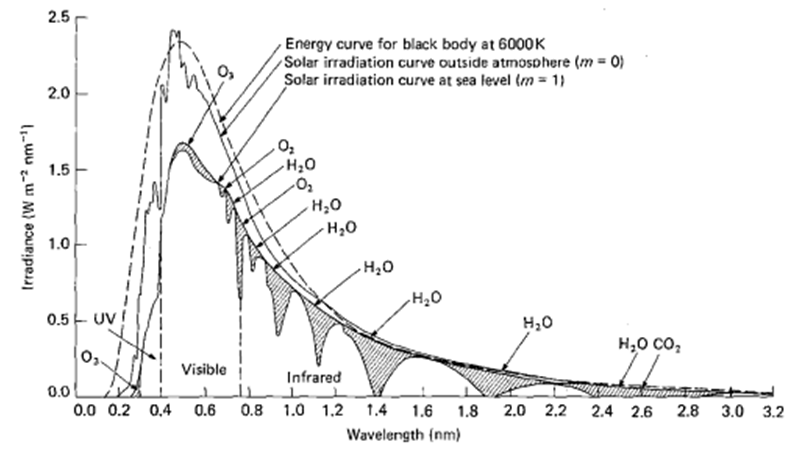
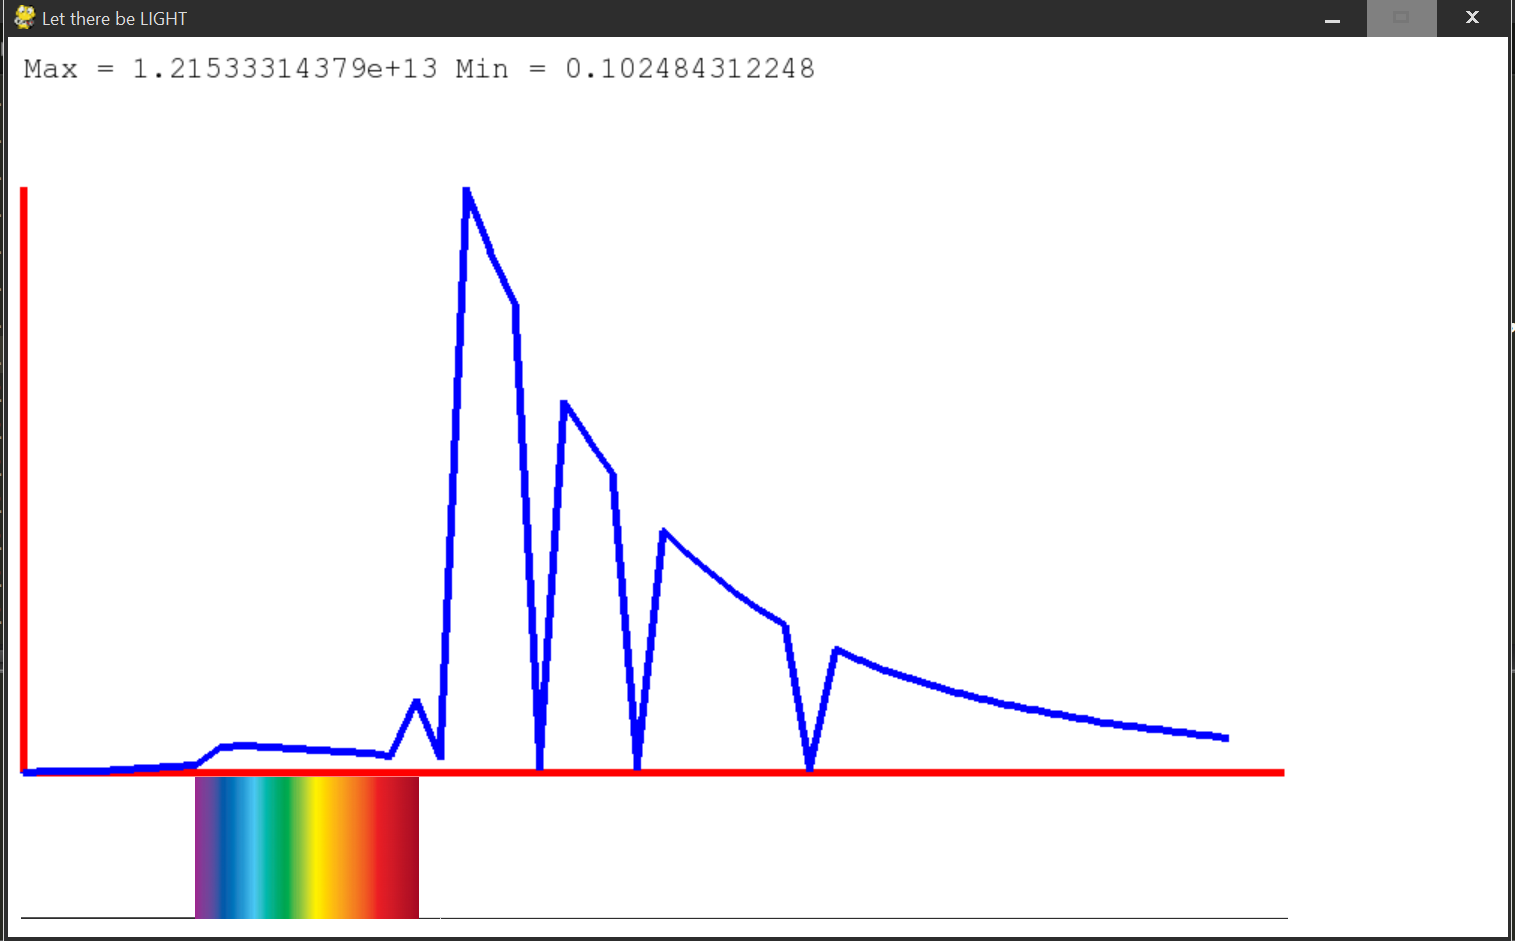
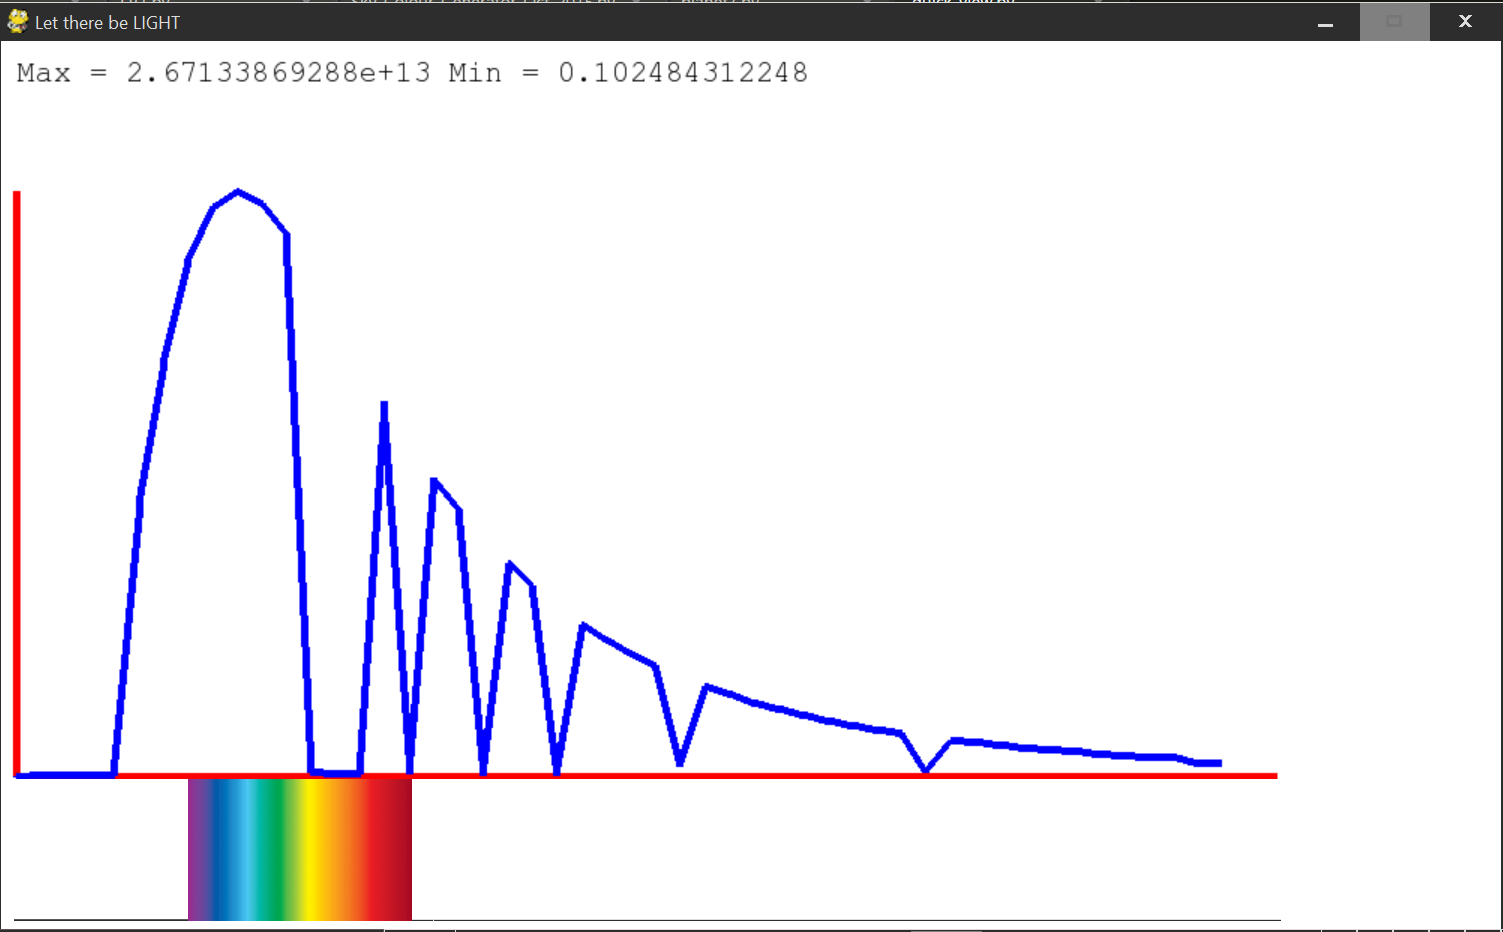
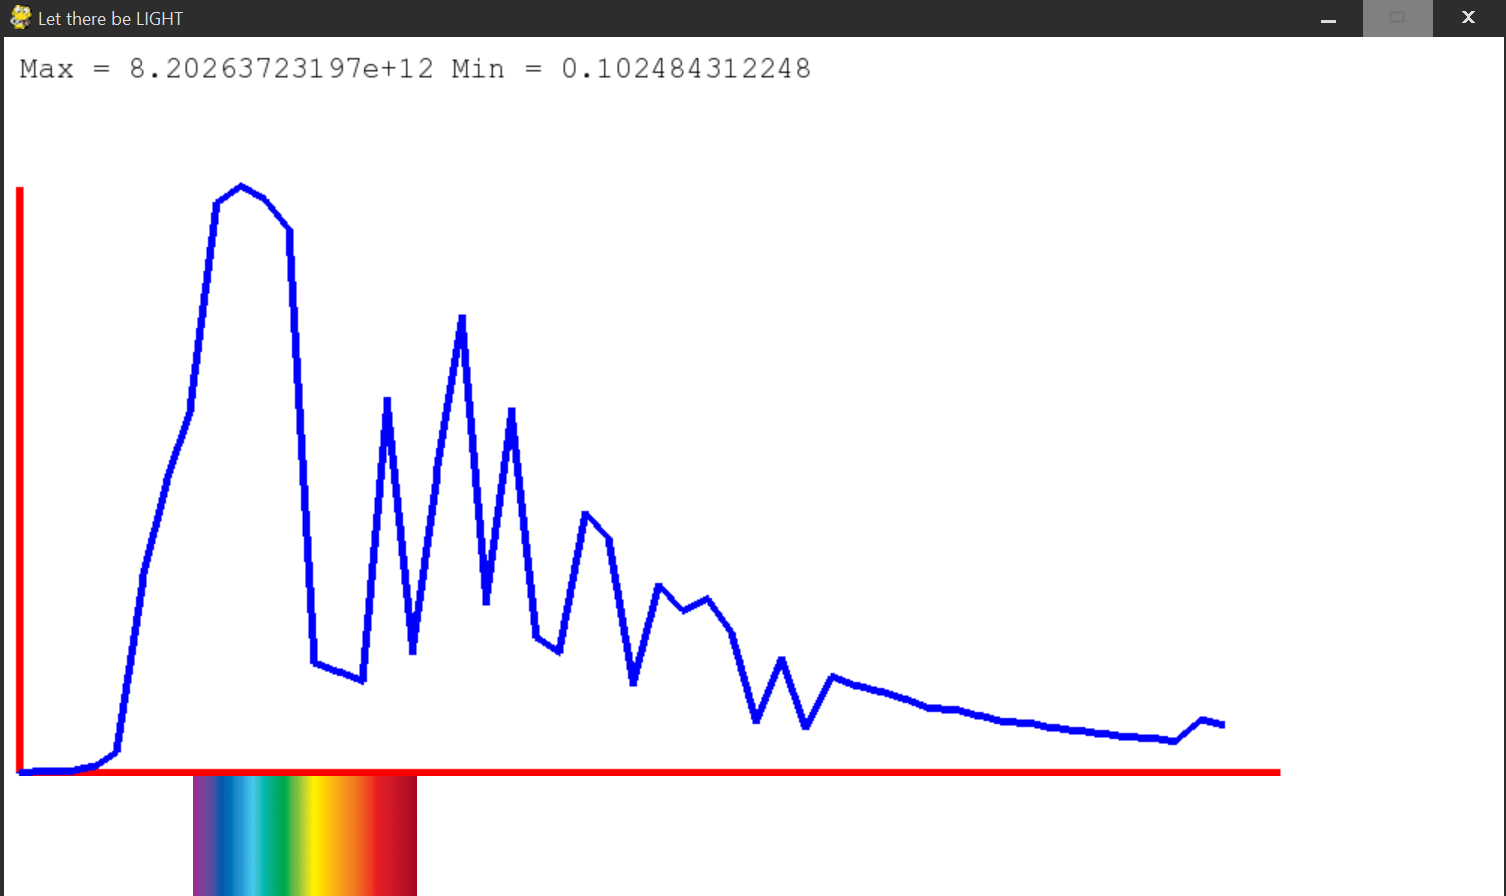
Here is some guessed data for gas absorption in the earth’s atmosphere. This is then going to be used to work out a fudge factor, so the spectral cacluations come out right for the earth, which can then be used to extrapolate for other planets.

N2 :
Base = 0.5

Microns, Fraction Absorbed, Fraction of Base Absorbtion
0.05, 0.8, 1.6
0.05, 0.8, 1.6

O2 + O3:
Base = 0.5

0.15, 0.2, 0.4
0.20, 0.2, 0.4
0.25, 0.2, 0.4
0.30, 0.2, 0.4
0.35, 0.2, 0.4
0.40, 0.3, 0.6
0.45, 0.3, 0.6
0.50, 0.3, 0.6
0.55, 0.3, 0.6
0.60, 0.3, 0.6
0.65, 0.3, 0.6
0.70, 0.3, 0.6
0.75, 0.3, 0.6
0.80, 0.5, 1
0.85, 0.3, 0.6

1.05, 0.2, 0.4
1.25, 0.2, 0.4
1.60, 0.2, 0.4

Water:
Base = 0.5

0.05, 0.2, 0.4
0.10, 0.2, 0.4
0.15, 0.2, 0.4
0.20, 0.2, 0.4

0.60, 0.2, 0.4
0.65, 0.2, 0.4
0.70, 0.2, 0.4
0.80, 0.2, 0.4

0.95, 0.5, 1
1.10, 0.5, 1

1.35, 1 ,2
1.85, 1, 2

2.40, 1, 2
2.45, 1, 2

Carbon Dioxide:
Base = 0.5

1.40, 0.3, 0.6
1.50, 0.1, 0.2
2.00, 0.5, 1

I just did something cool which I thought you guys might like! I ran the planet generator to try and generate the earth, to see if the calculators were working correctly. The only things it sets are the mass of the sun and the radius of the earth, everything else is computed. Here’s the results, as you can see they are pretty good!

Created new main sequence star
Mass = 1 solar masses.
Life Span = 1.00e+10 of our years.
Luminosity = 3.85e+26 watts. should be 3.856e26!!
Radius = 6.96e+08 meters.
Temperature = 5777.62658506 Kelvin. should be 5778!

Created new planet.
Orbital radius = 1.48e+11 meters. should be 1.496e11!!!
Radius = 6.37e+06 meters.
Mass = 5.97e+24 kg.
Orbital period = 3.12e+07 seconds = 0.988059102892 earth years = 1 year for this planet.

Which, as you can see, is super close. I am very happy with the orbital radius, the habitable zone calculation put the earth in exactly the right place. By this model the earth is right in the middle of the habitable zone!

In other news this is the current solar spectrum generated for the earth

and this is what it should look like

So yeah some more work needed there! First part of the graph looks nice.

Edit: Posting this and this for reference because I should get around to reading it.

4 Likes

This is coming along great! Good job!

1 Like

Ok so I’ve played around with this a bit. There’s quite a lot of fudging going on. These images in order are

  1. Spectrum from space.
  2. What part of that spectrum gets through a planet with very thick atmosphere made only of nitrogen
  3. Heavy Carbon Dioxide only atmosphere
  4. Heavy oxygen only atmosphere
  5. Heavy water only atmosphere
  6. Atmosphere on an Earthlike planet

As you can see the nitrogen calculation is pointless (because the values are so small in that frequency anyway (this is for a star much like our sun but black body radiation gives similar output for brighter stars)). The carbon dioxide calculation is pointless too as it doesn’t really affect much in the important part of the spectrum (but is very important for climate change because the earth radiates in the deep infra red. So walk don’t drive! lol) The spectra produced are pretty close.

The procedural chloroplasts generated would be a bit wrong for the earth (they would probably be yellow not green because that is the lowest part of the spectrum). Not sure what to do about that. How much should we fudge so the earth is correct? (You can see a diagram of what it should look like in the post above).

2 Likes

(Hate askin this but, would this be able to generate gas giants that are capable of housing life? It would presumably just be putting the gas giants in the habitable zone yes?)

If you need to fudge it around to fit the earths chloroplasts then maybe you can make it so the atmospheric compression is different, after all trees are green because (I believe) the blue sky cancels out the yellow I think.

Any questions of life on gas giants will have to be put off indefinitely, sorry (barring speculation which does not belong here).

@tjwhale it doesn’t look like you model Rayleigh scattering yet (though I swear you’d done it once already) - that attenuates the blue part of the spectrum, as an appreciable fraction (a third) of scattered light ends up escaping.
You could approximate it by having a scatter factor that scales to the inverse quartic of wavelength (simply ignoring the rest of the Rayleigh scatter equation), and making another spectrum for scattered light, while attenuating the direct light spectrum. Then, a third of the scattered spectrum would be added to the spectrum for reflected light (which I think would be useful to keep track of, even now, for photon accounting ourposes), while the rest would also be available for photosynthesis, vision, etc. If we were to model indirect sunlight separately, then this spectrum would also be what we use for that.

@Moopli The problem is that I just put in a fudge factor to increase the blue end of the spectrum. You can see how it was before that on the post above.

I think it’s reasonable as it is. A photosynthesizer would choose to use blue which is correct for the earth. It’s just that green plants use red too and the red spike is maybe not high enough for them to do that (there is a nice spike in the infrared though).

One thing I am happy with is how oxygen affects things. LIke if you were on a planet with massive oxygen you would use all infrared for your photosynthesis, very little visible would come through. That’s really cool. It means gas composition does actually affect photosynthesizer colour choice which is what we wanted (based on that article you posted).

1 Like

Why the fudge factor? Did you remove light due to rayleigh scattering, but not add back 2/3rds of the scattered light? Was it lacking blue even without rayleigh scattering?

This is what it looked like without the fudge factor, as you can see there is too much infrared already. Currently there is no scattering at all as that would take it even further from where it’s supposed to be.

I spent some time this weekend porting this code to c++ as a learning exercise (it’s so much faster which is great). I hope the code is reasonable, I CamelCased everything but I’m not sure if that’s right :slight_smile:

Things which still need to be added;

  1. Red Dwarfs as a second type of star you can orbit.

  2. Computing how the light spectrum decays as you go underwater.

  3. Determining which are the best colours for chloroplasts to use (which should be easy, it’s just finding the largest values in the TerrestrialSpectrum as they will give the most power).

  4. Letting the player interact with the system. Basically I’ve set it up so that if a player determined variable (of which there are very few) is set by the player then all the subsequent ones (the computations have an order) should be set to 0. If the program detects one of these is 0 it will generate a random value for it.

So basically the player can set the mass of their sun and then press compute and all other variable will be filled in. However if they then go and change planetary radius then only the computations after “planetary radius” is set will be redone. This means you can compute a planet and see if you like it and change things later.

However, because the calculations have an order, you can’t go back and change earlier ones without changing later ones. Hope that’s not badly explained. Should be a cool feature!

I won’t have any time to work on it for a while.

2 Likes

To inform my searching, I had a few questions about computing light absorption in water.

  1. I assume we need to determine a credibly sourced absorption spectrum for water (both pure and with various solutes)?

  2. And we then need to determine how quickly the levels of non-absorbed (or poorly absorbed) light drop off with volume of water passed through?

  3. Following which we need to figure out decent fudge for what I assume will not be literally miles deep seawater in game due to technical limitations?

  4. Is there an aspect that I’m missing or anything that I’ve mentioned wherein I’m focusing on the wrong aspect?

1 Like

Yeah interesting. I think you have it about right.

As you say we want to know, for a given wavelength of light of x meters what percentage will make it through water of depth y. So if I had 100 watts of blue light on the surface how many watts would make it through to a depth of 10m, for example. Then this needs to be worked out for all 50 wavelengths which are used in the simulation.

You could think about solutes but I’m not sure how much difference that will make. I think the water is probably the most important part of it.

As for point 3 the plan has been to map out the patches schematically. So yeah some will be at the bottom of a miles deep ocean (and the light there will basically be 0) but there could be others at a depth of <100m (like a beach or a shelf near the shore) which will experience much more light. You can’t swim between patches so it’s ok for them to be arbitrarily far apart.

I imagine this will mean that all light is attenuated by something like exp(depth) but if it affects the optimal colour to use for photosynthesis (meaning the wavelength with the most light getting through in total) then that is much more interesting. If you haven’t seen it this is the article moopli posted which got us thinking about this whole question (of which colours should the chloroplasts be) https://www.ebscohost.com/uploads/imported/thisTopic-dbTopic-1033.pdf

Have a look at the function “ComputeLightFilter”. That derives the filter for the atmosphere. As you can see I manually inputted each wavelength and how much it interacts with different gasses. The wavelengths used are Filter[i] wavelength = 0.05 microns * i. So the first is 0.05 and the second is 0.1 etc. As there are 50 the highest value is 2.5 microns so any wavelength larger than this can be ignored.

1 Like

More important than solutes (at least, at the trace concentrations which I assume our seas would have) is particulate matter; both opaque (like silt) and translucent (like cyanobacteria). We need to work with turbidity to figure out how much light gets scattered back upwards and absorbed, and do some extra stuff for translucent particles to filter what light gets through.

1 Like

@moopli do you think that reflected light is important? Either from a moon or from bacteria in the water or something like that? My assumption is that it’s going to be very weak and it’s going to be proportional to the incoming light so overall won’t lead to different mechanics. For the aware stage on land, for example, I suppose it’s important to know how bright it should be on a moonlit night, but that’s about the useful limit imo.

If you think it’s important let’s look into it.

In reference to the reflected light of the moon, I found an article on PubMed (http://www.ncbi.nlm.nih.gov/pubmed/16916290) that deals with non-solar sources of photons for photosynthesis. Apparently the amount of reflected light (at least in the concentrations the moon provides) is rarely sufficient for photosynthesis, and the researcher suggests it’s only a viable source near the full phase. I assume that as one enters into the water this drops off further.

That being said, I’m still looking for the math on that because it’s possible that more moons or more reflective moons could make a big difference.

1 Like

Sorry for double post.

I’ve been working a bit on plotting potential graphs of spectrum absorbance with the guidance of TJWhale. I encountered a bit of a conundrum and I decided I should seek some further help.

Given how simple (read: not easy, but simple) the system in question is, I think I’ve been reinventing the wheel (and doing so quite poorly). It’s dawned on me that it can really just be a static light penetration distribution based on the NOAA chart, which can then have a sin(phi) coefficient to account for angle of deflection (i.e. polar regions will receive less light penetration than tropical regions).

The problem that I’ve encountered with graphing though is that I’m not sure how to integrate the intensity of the light in a realistic manner (specifically, there’s a lack of data on how different stars impact their planets’ oceans given our limited sampling capabilities as a species), and so far I’ve just plotted individual penetration data based on expected values, so if there’s a decent distribution function I think it’d improve vastly on my code.

Edit: Chart of expected value: http://oceanexplorer.noaa.gov/explorations/04deepscope/background/deeplight/media/diagram3.html

Firstly I think reinventing the wheel is always a great idea because it really helps you understand how the system works. For me Thrive has been great for learning stuff, my cell biology has improved immensely.

Secondly I think you’re doing great. Just go slow and don’t stress yourself out and feel free to ask for as much help as you want. The hardest big is figuring out how it should work.

It’s weird that it’s different in coastal, I was not expecting that.

This is what I’ve been imagining. Have a function which does

Scaling(Wavelength) = Use the NOAA chart to guess some values so the graph shows where the intensity has decreased to 20% of it’s original value

UnderwaterLightIntensity(Intensity, Depth, Angle, Wavelength) = Intensity*sin(Angle)exp(-DepthScaling(Wavelength))

So for example take blue light. Put in the formula Intensity = 1, Angle = pi/2, Depth = 200 then compute the value of the scaling to give light intensity of 0.2. Once you have this then you can make a function out of for the scaling for the other wavelengths (which will be greater so the light decays faster). (Infrared should basically be blocked out entirely, which is interesting).

Then make another function which takes the whole array of light intensities on the surface as an input and computes UnderwaterLightIntensity for all the wavelengths one by one and produces an array as an output (which will take Depth and Angle as parameters). Then for any patch we can input the surface intensity array, and Depth and Angle and get a spectrum out in return.

So
for (i = 0, i < LenghtOfArrays, i++) {
UnderwaterSpectrum[i] = UnderwaterLightIntensity(SurfaceSpectrum[i], Depth, Angle, Wavelength = 0.05*(i + 1));
}
or something like that.

Also you could then add a new variable to scaling so that the coastal values are different.

Does that all make sense?

1 Like

On first brush I think I follow.

In light of recent events (roughly 1/3 of all sentences in 2016 start this way), I probably won’t be able to build on the (minimal) work I’ve started until Friday, so I guess I won’t really know if I understand til then.

Thank you!

1 Like

Would all of the light be coming in from a certain 1-180 angle? Or would it be possible for it to come in from any angle (albeit thats kinda improbable). Also would water color affect the light going under the sea (since water is intrinsically slightly blue in color)

I wrote up a script to calculate the fudge factor for each wavelength when supplied with wavelength and expected depth of penetration (based heavily on the pseudo-code above). The problem is that I’m not certain what depth we’re expecting for Near Infrared and Ultraviolet. Has anyone found values for those?