So for a while I’ve sort of been brainstorming an alternative form of a unified population sim/auto-evo which focuses on smooth changes over time, rather than the large jumps that currently happen every editor cycle. At the moment this is kind of its own thing, disconnected from anything actually implemented in Thrive. My plan is to sort of mess around in this sandbox until hopefully I create something worthwhile, then look into adapting it and implementing (or helping implement) it in the game.
Most of the time my attempts to find solid ground are frustrating and fruitless, as I don’t have much experience with simulations or all the complex math I need, but I feel I have made a few steps in the right direction.
Here’s one of the first, which made me want to pursue the idea further:
✨the graph✨
(Pardon the slow speed at the start. The simulation itself isn’t laggy, but my graph scrolling code is!)
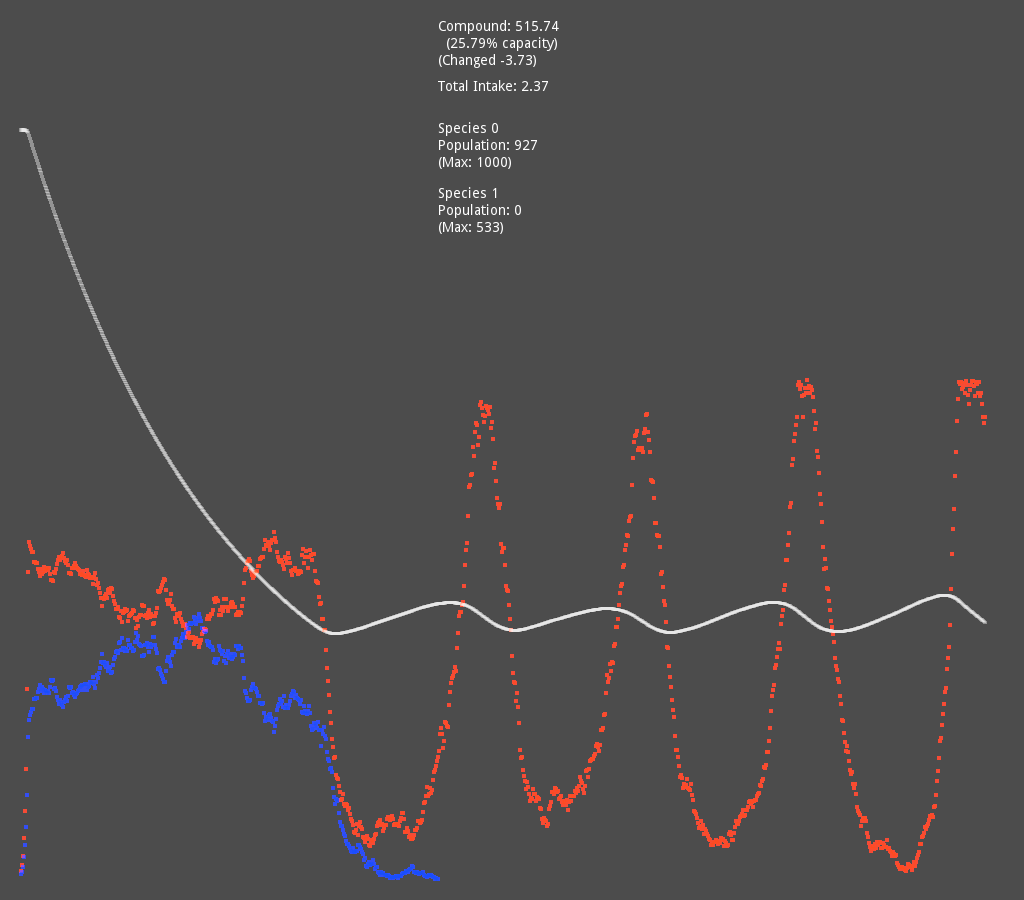
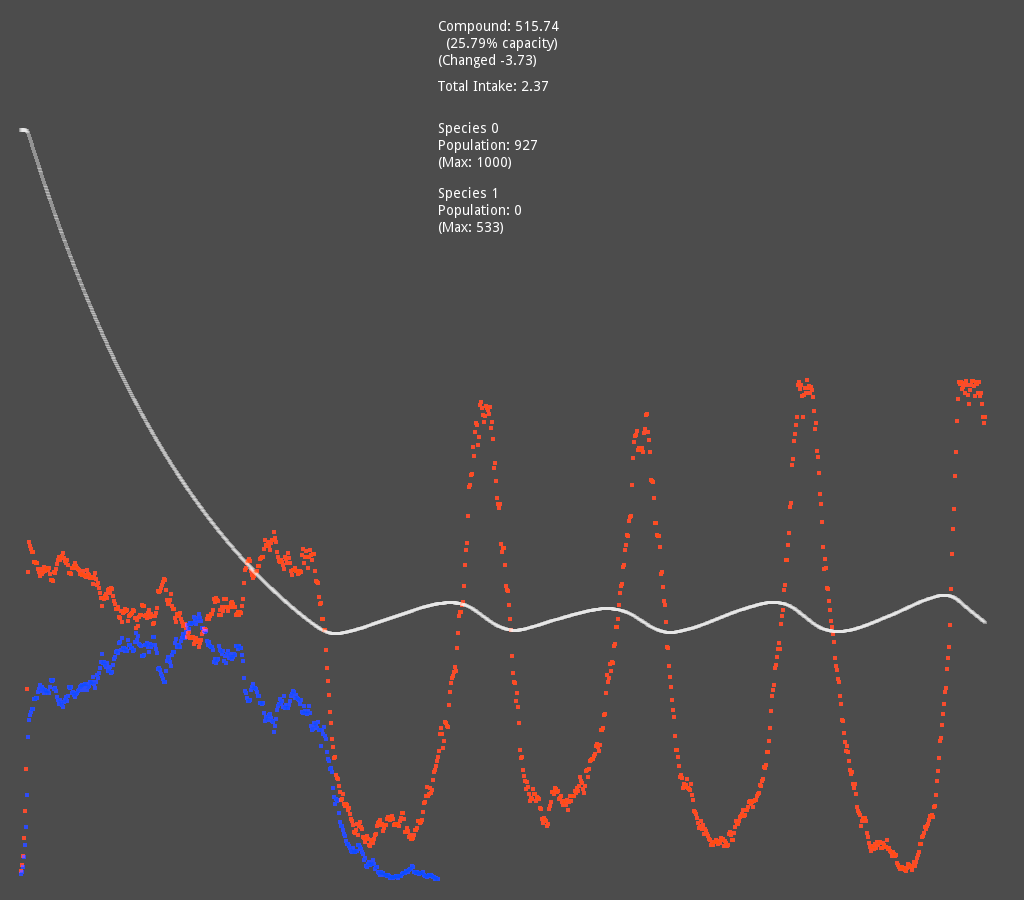
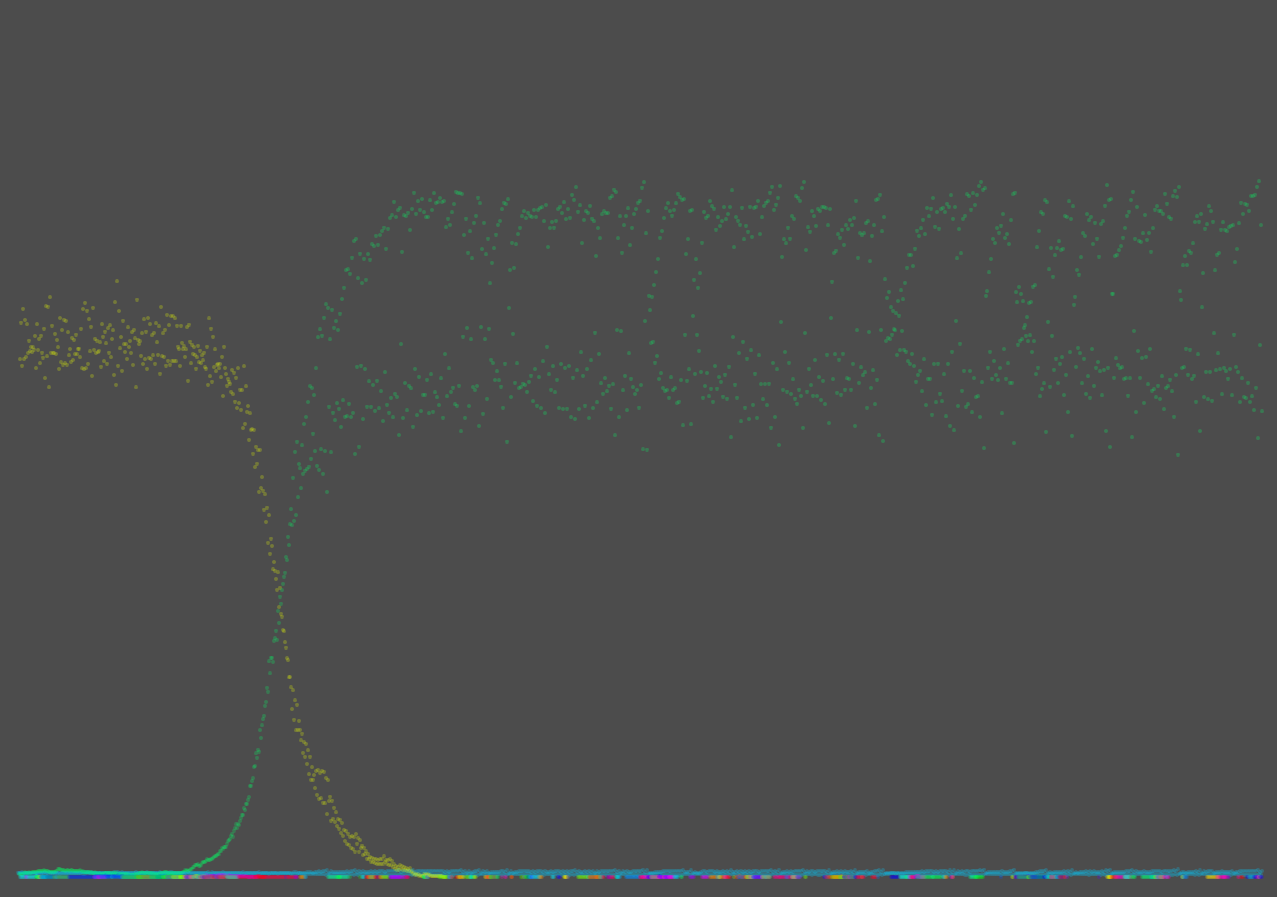
This is a simulation I made quite a while back. It starts with a single organism with a population of 1 in an environment with a single compound which is required for both survival and reproduction.
Every step, the change in population for each species is based on that species’ characteristics, compound amount, and physical space left in the patch. For every new individual born in a step, each one has a very small chance to instead create a new mutant species with slightly tweaked characteristics and a population of 1.
There is an unintended behavior at the beginning of the simulation, where LUCA (the white line) almost instantly reaches carrying capacity, and a large number of new species are created (multicolored overlapping lines at the bottom) but are unable to grow in population because there is no room left to do so.
After LUCA dies out due to plummeting compound levels, however, all those species get a chance, and you start to see new ones appearing and outcompeting the last by adapting to be smaller and thus having a lower reproduction and upkeep cost, which really delighted me the first time I saw it happening because I thought I’d have to somehow program competition manually.
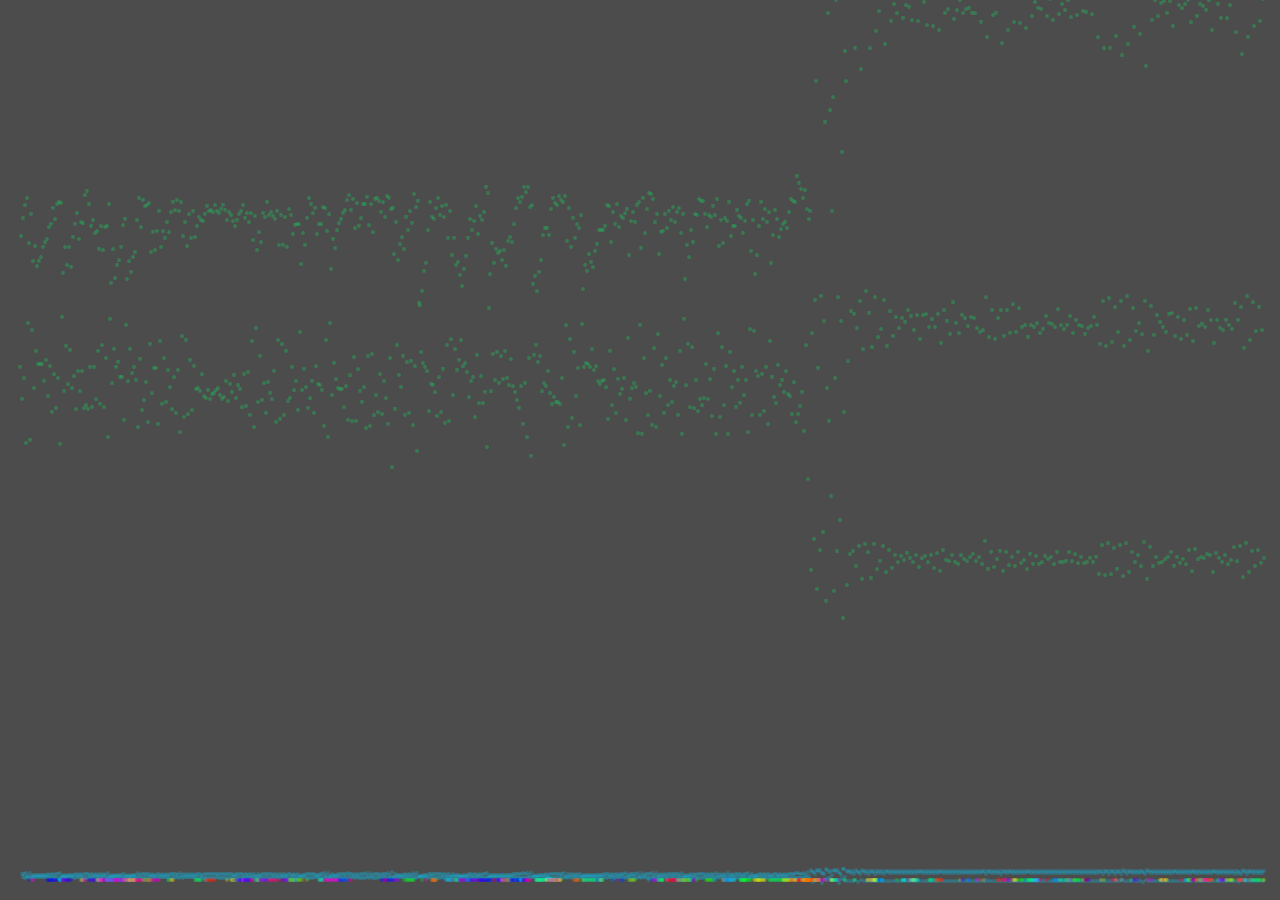
There was also an earlier version with much more randomness built in, which had some nice oscillations between the cells and the compound concentration!
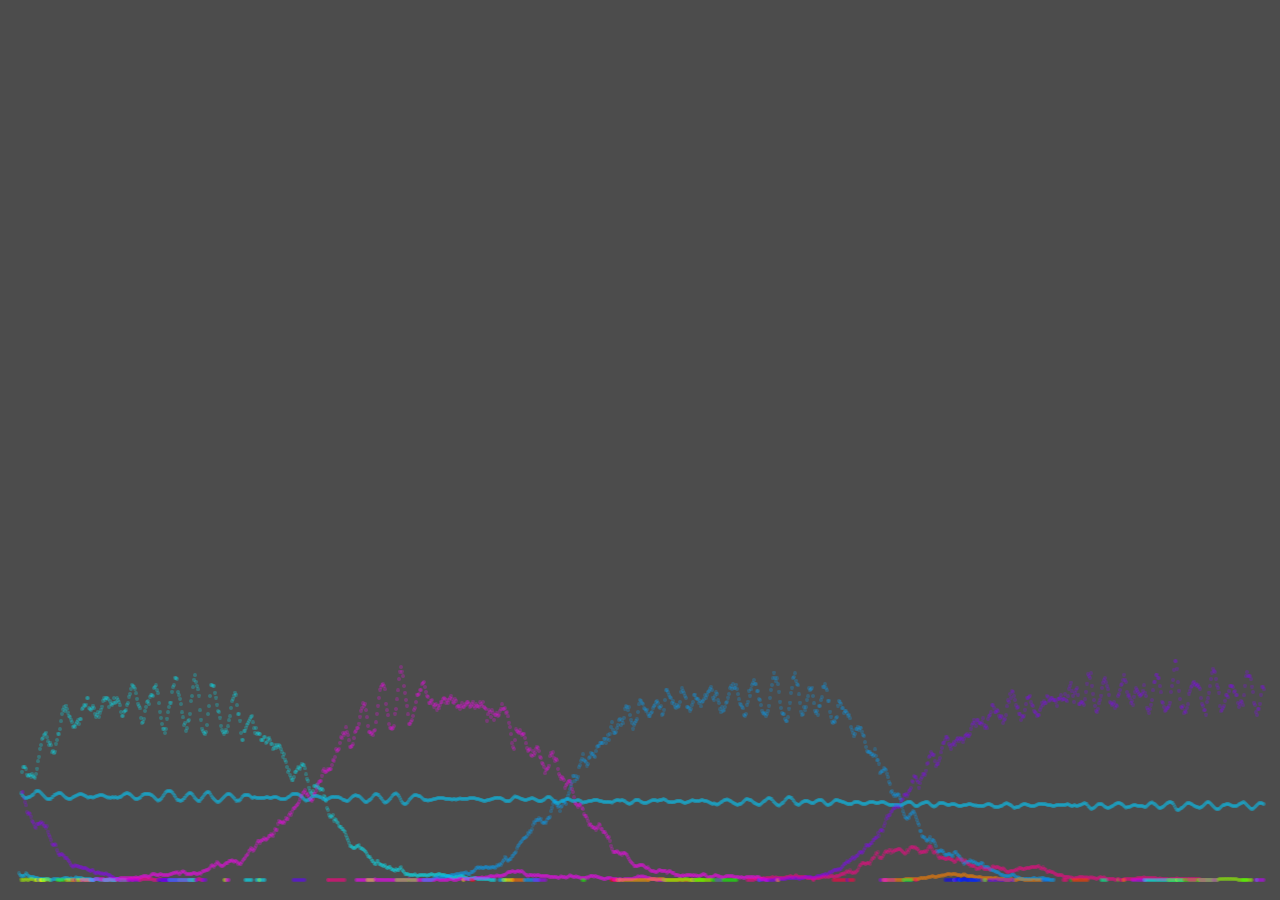
However, the way I did this randomness is potentially very expensive, looping through every member of a species and using RNG to decide whether each one dies or reproduces. I believe I could use a normal distribution to more cheaply achieve the same effect?
It also got very chaotic near the end and even started bifurcating (and trifurcating?) (probably mostly because the numbers got so small)
Aaand here’s a few more attempts with varying levels of success.
patches, compounds, and cells
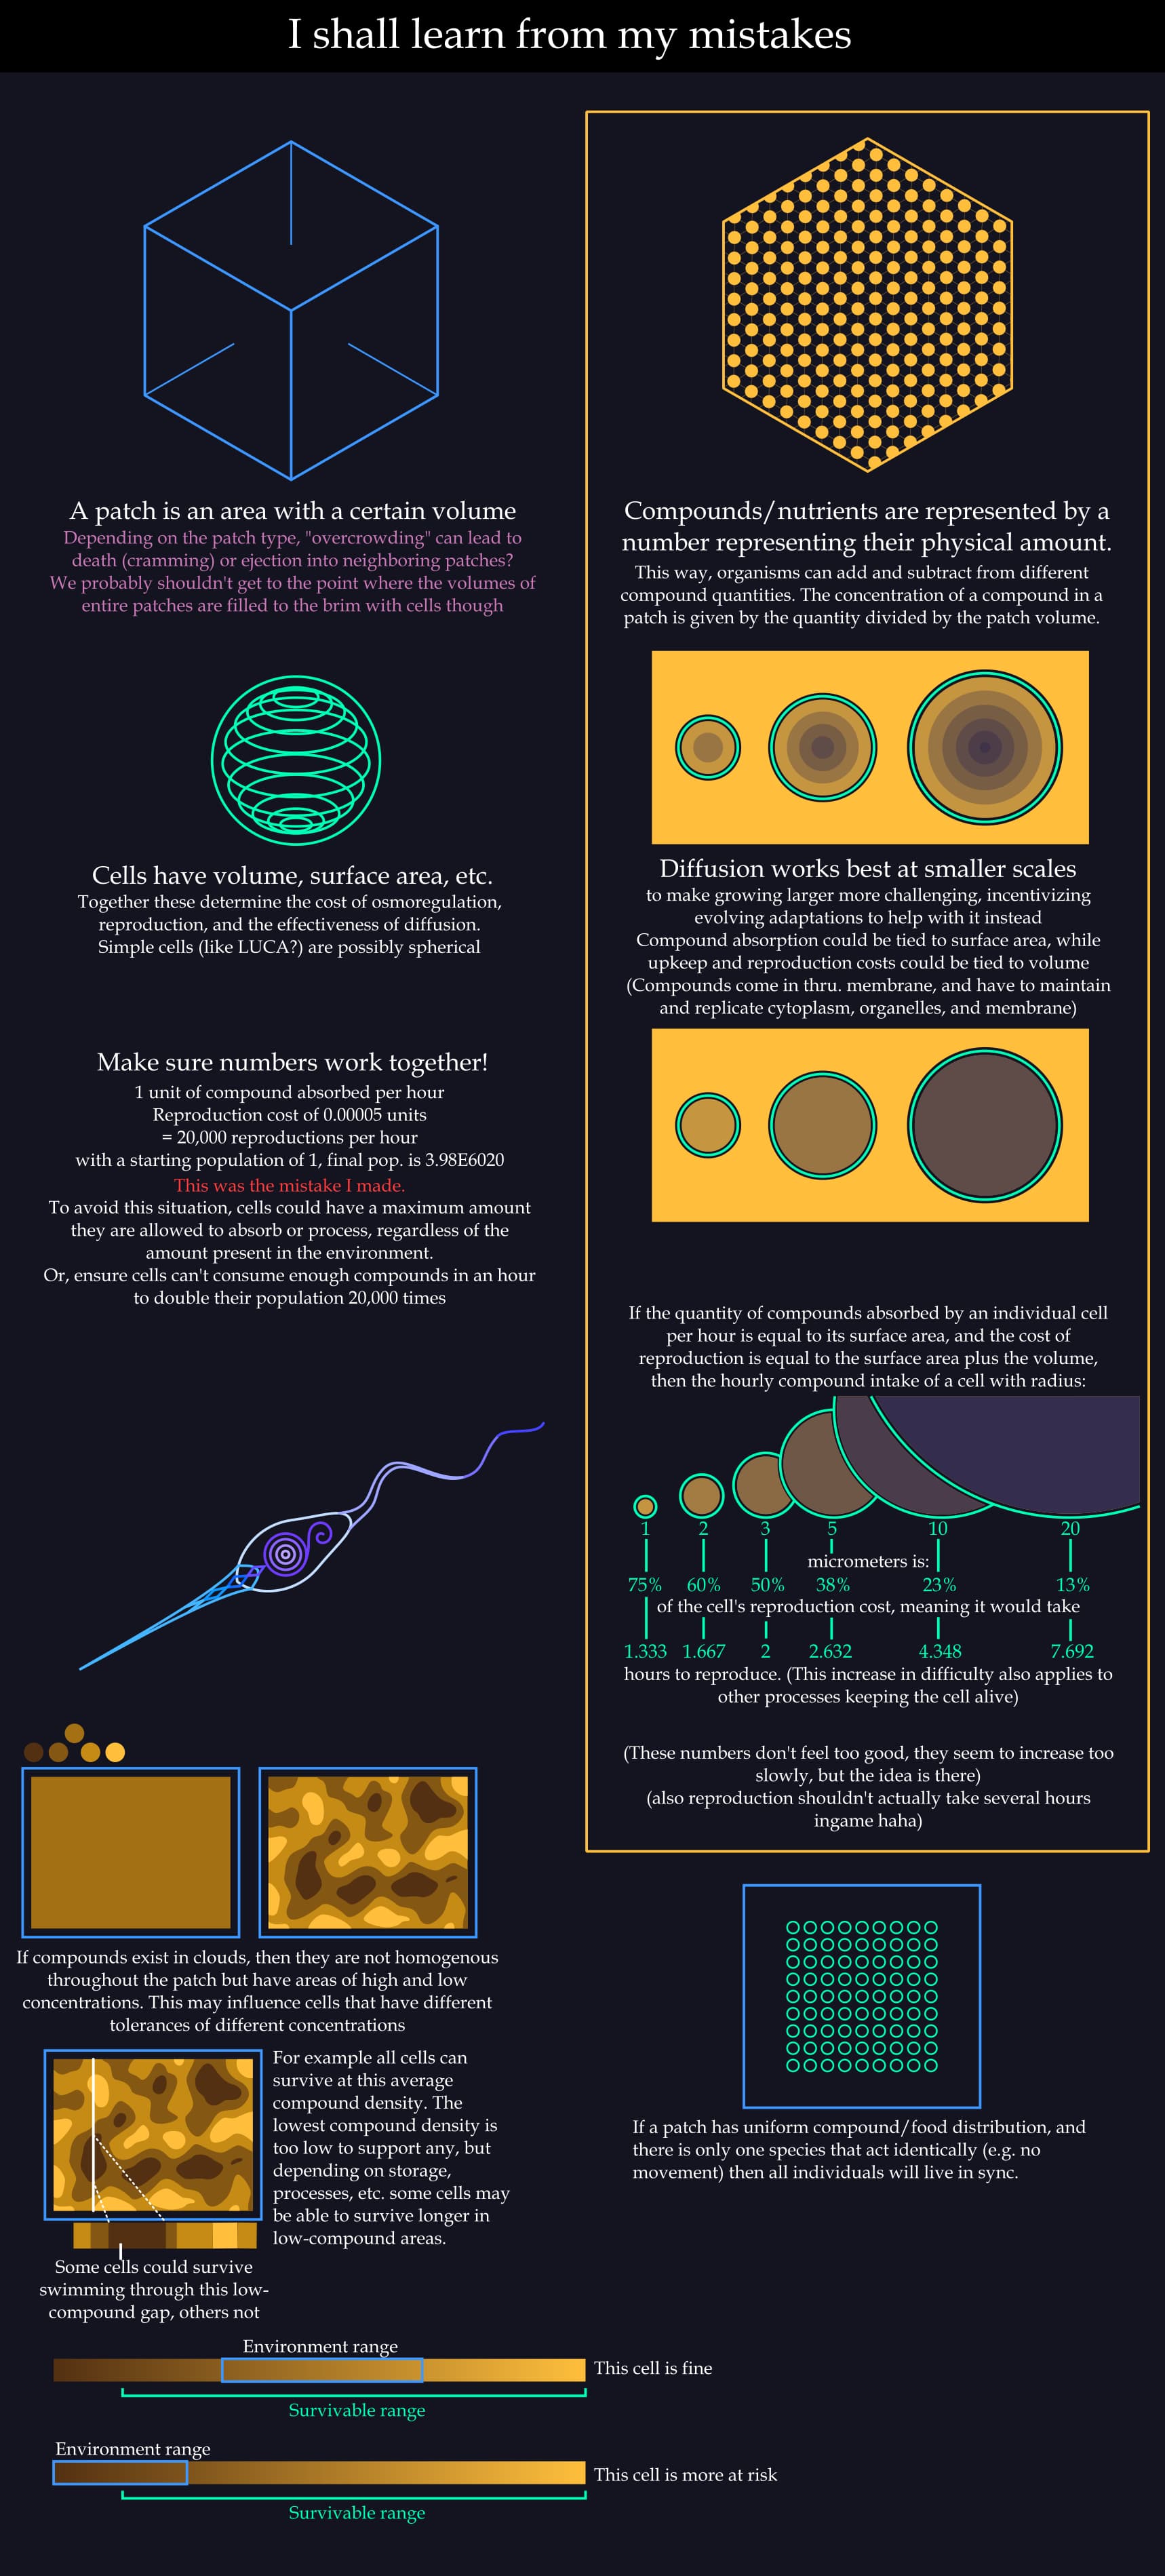
Here’s a whole sheet where I compiled a bunch of information relevant to simulating unicellular life, which I made after attempting another graph simulation that went horribly wrong because I made a goof with numbers. I also looked at diffusion a bit and how overly bulky cells could be hindered by compounds diffusing into them too slowly, and how surface area and volume could cause that.
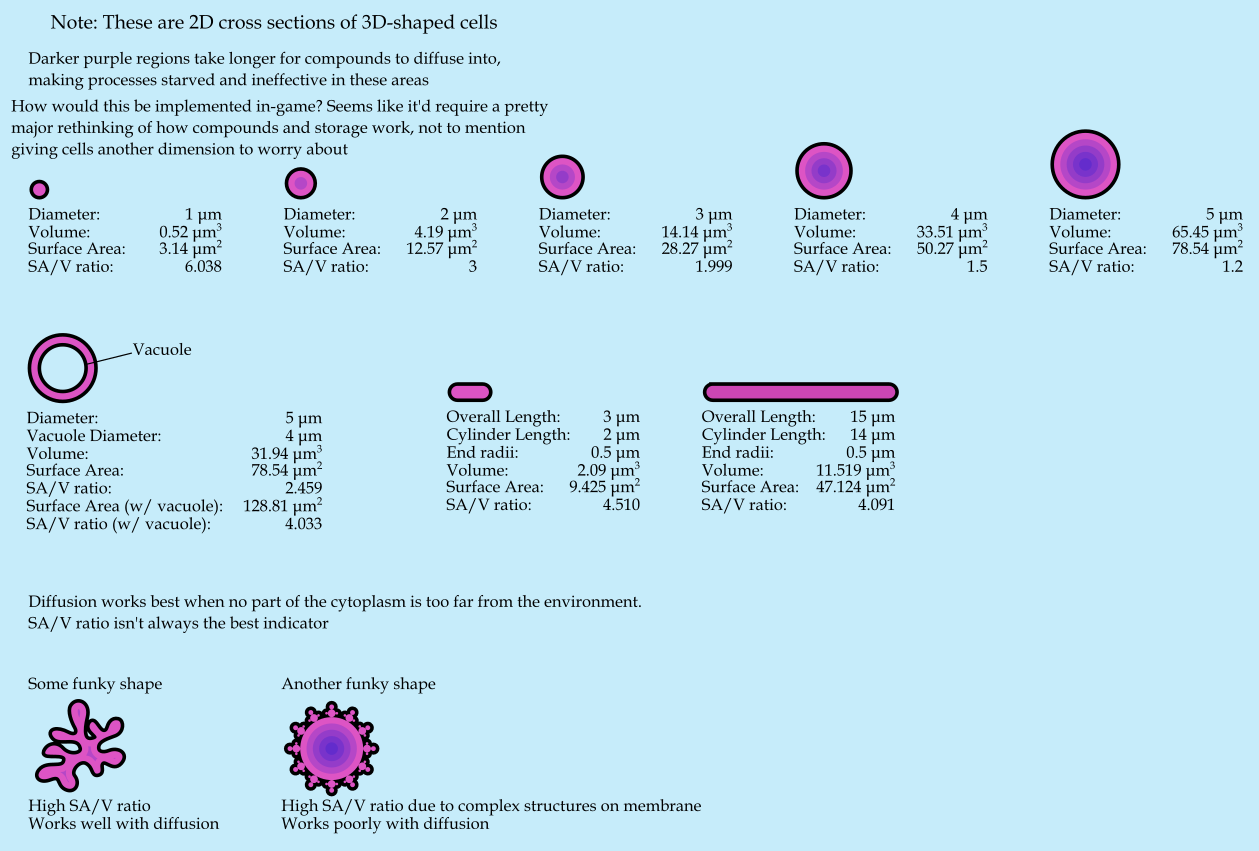
(Here’s another concept on diffusion:)
Overall there’s not really anything technical regarding the simulation, just brainstorming how things “should” work.
Here’s some notes on math and stuff that were off to the side. As you can see I again didn’t get much figured out

predators, prey, and pie charts
This was an attempt at figuring out how to simulate a single predator roaming through its patch until encountering prey, which either succeeds or fails. I eventually gave up on it.
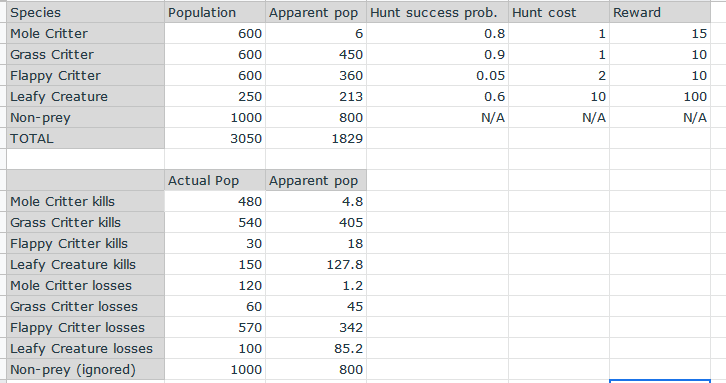
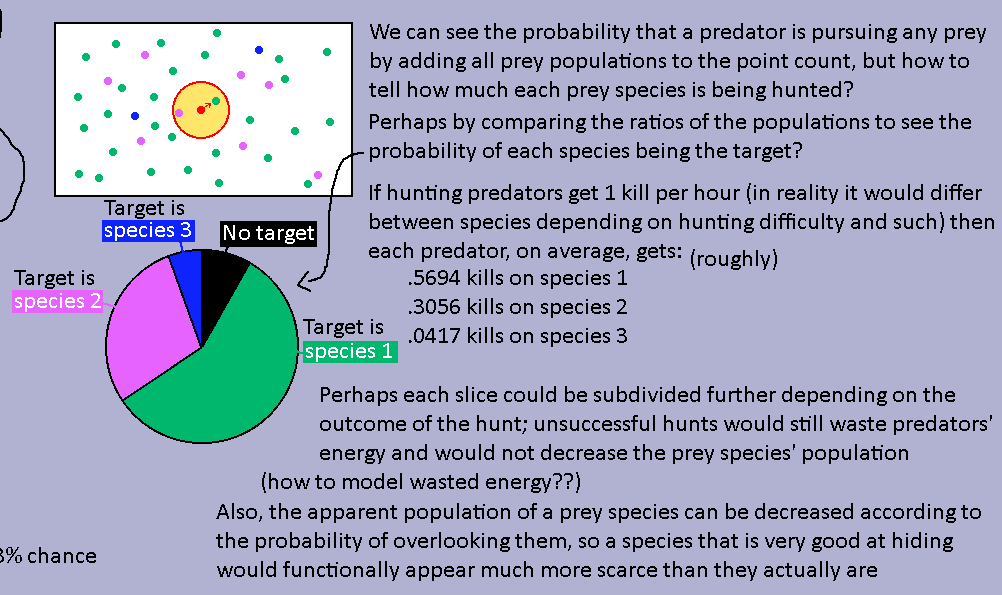
Here’s some stats: the population of each species in the patch is at the top. “Apparent pop” is a measure of how many members the predator can actually encounter, and can make a plentiful species appear rare if it’s good enough at hiding.
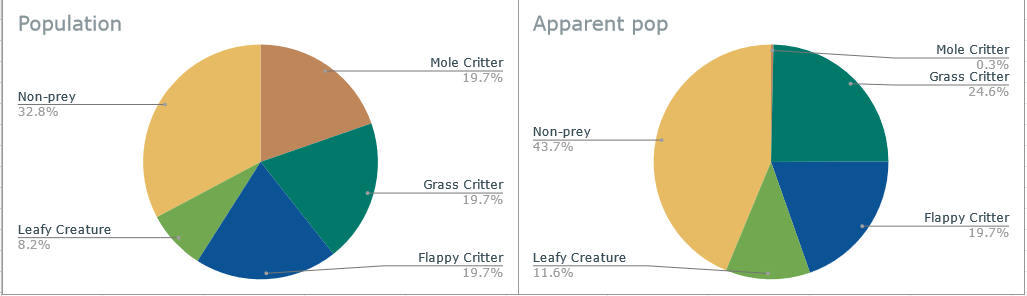
Here’s both the actual populations and apparent populations from the previous image displayed in a pie chart.
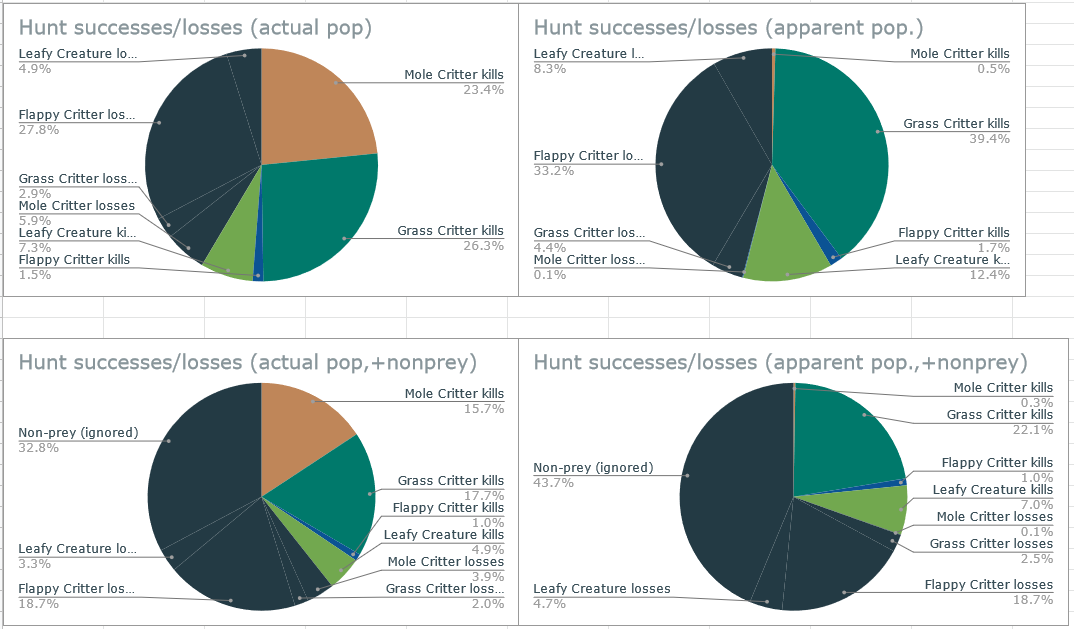
And some more pie charts! These show how often a predator would successfully hunt and kill each prey species, and how often it would fail these hunts.
lotka, volterra even
I didn’t accomplish much with this, aside from making a totally awesome vector field simulator in Desmos

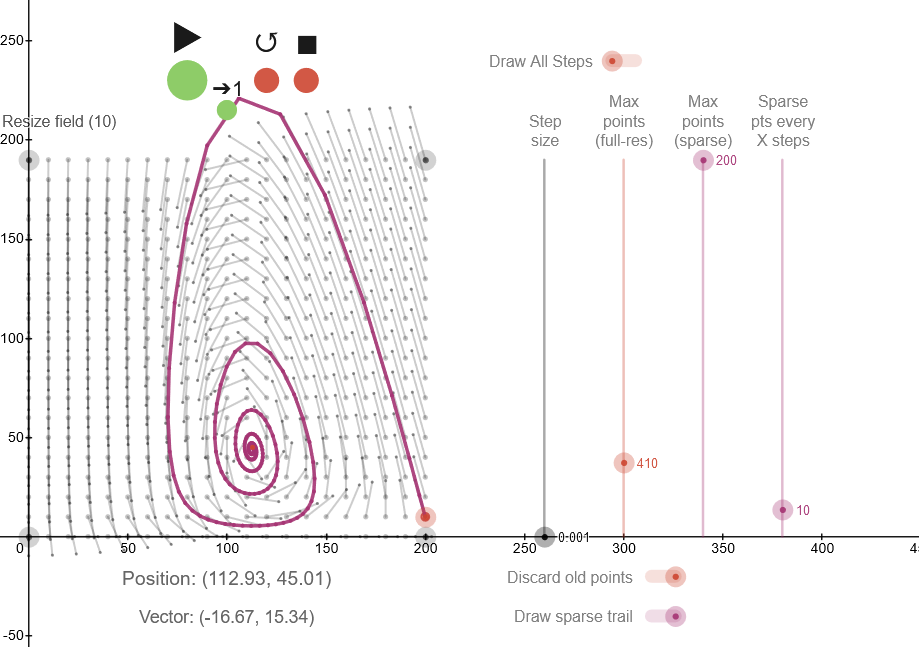
I had trouble finding any one approach that would be universal for any scale. A spiral could look nice with certain starting numbers, but if I move them way up to the thousands or millions (where actual populations would be) then the math might get crazy and go all over the place and overshoot into the negatives. I Did see that having a small step size was important if I wanted a more accurate curve
step thing
This one’s sorta tough to explain; a lot of these were mostly just made for me to put my thoughts together in the moment.
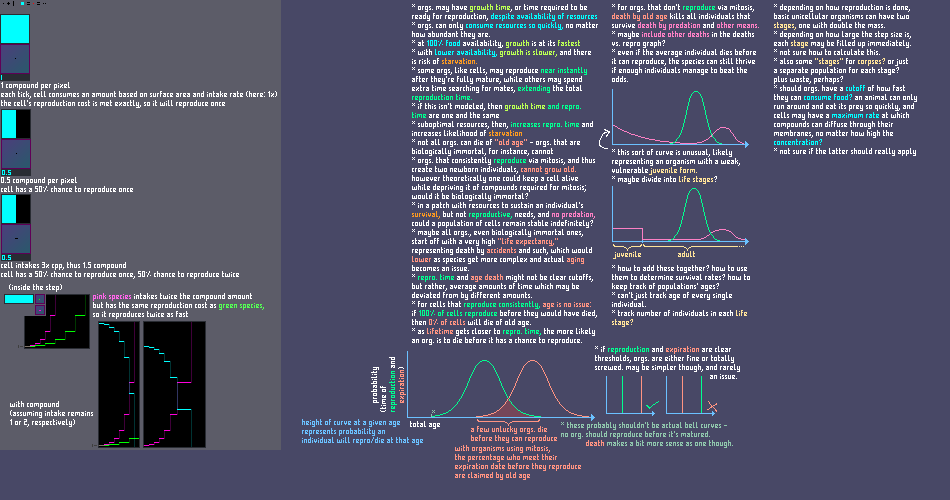
It goes over compound intake amounts and things to keep in mind when trying to simulate the lives of organisms. It’s kind of a mess, and not much actual technical progress, just a bunch more things to worry about getting right.
And now here I finally feel i’m starting to get some actual technical progress!
✨numbers simulating dots✨ (in which i say "probability" a lot)
So the idea here was to first try to make a simple simulation where all organisms and food sources in a patch are represented as randomly-placed points on a grid, and then try to uncover some probabilistic truths behind that and make a program to approximate the exact same thing, but using only numbers.
(This uses a pixel grid, which isn’t really part of the overall concept and was just a simplification for this test in particular)
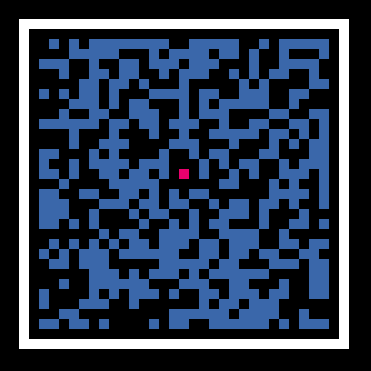
For instance, if you imagine every “pixel” in a patch has a 50% chance of having a compound and a 50% chance of not having a compound, then we know immediately that an organism placed at a random pixel has a 50% chance of being on top of a compound. Similarly, I also wanted to find if I could figure out how to find the probabilities of encountering and pursuing prey and such.
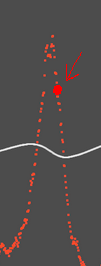
In the above image, the cell (red pixel) is not overlapping any compounds. If this cell is sessile and no currents exist, then neither it nor the compounds can move at all and it is doomed to starve. However, if we add currents then both the clouds and the cell end up getting pushed, the cell a little bit less than the clouds, allowing new compounds to wash over the cell.
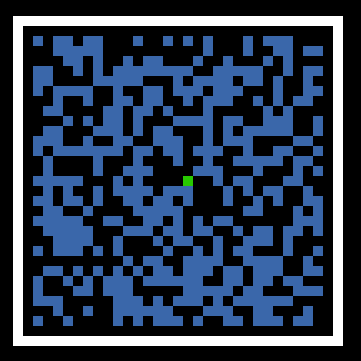
(Here, the currents are pushing everything southeast ![]() )
)
Of course, in game compound clouds are much less “fine-grained;” you can find large areas full of compounds and large areas that are totally sparse.
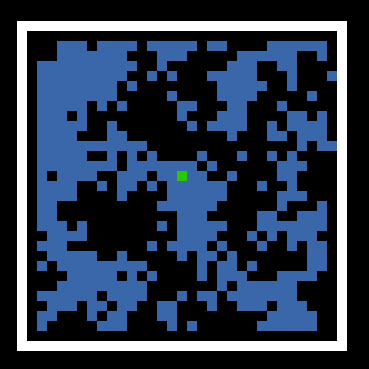
So even with the help of currents, the cell still has to worry about being pushed into a sparse region for too long and starving to death.
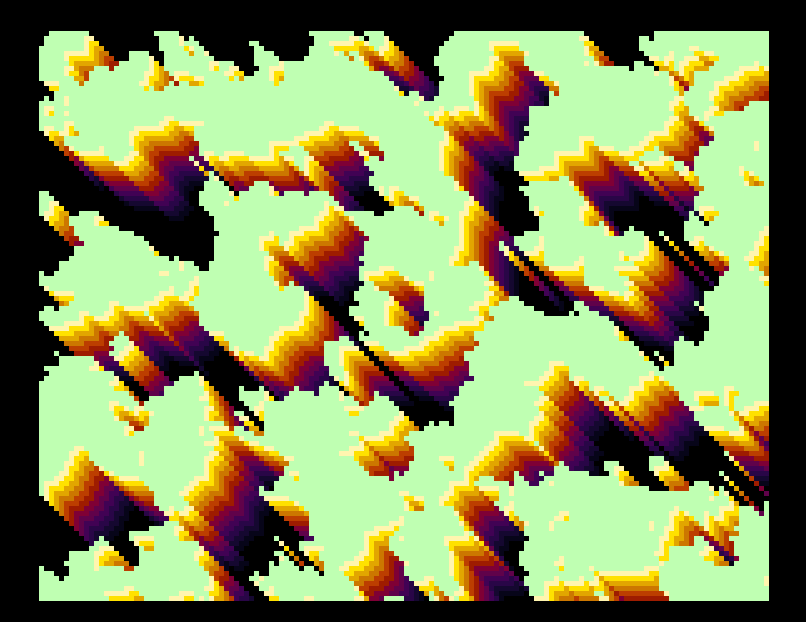
I wasn’t quite sure how to simulate this, and to be honest the whole thing was a little weird, because compounds aren’t a binary yes or no, and it’s possible compounds will be simulated as if it’s evenly distributed(?)
However, I feel I made much better progress imagining this whole situation as a predator/prey relationship.
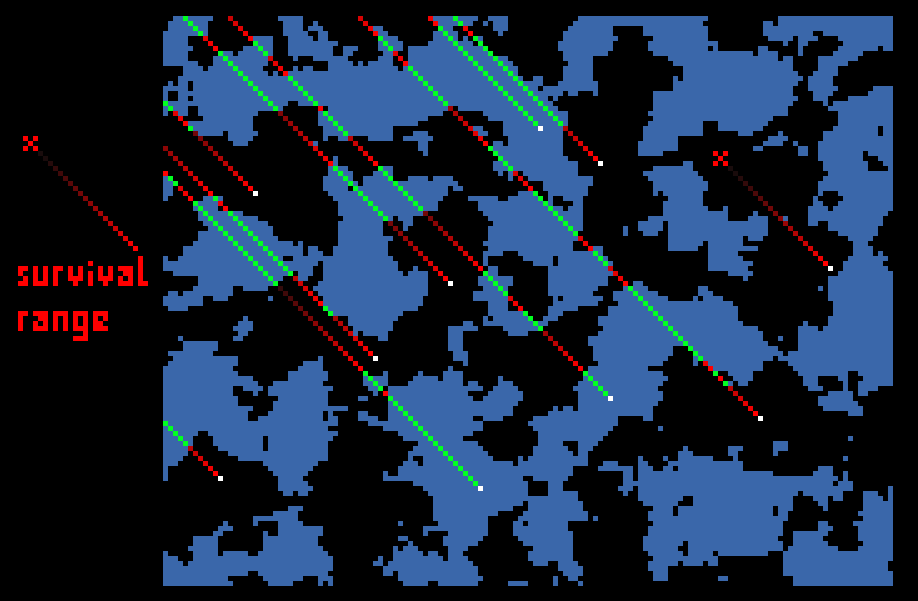
Imagine a patch as a finite 2D plane. Prey organisms (represented as green dots) are sprinkled randomly across it. If a predator has a certain radius around it, and any prey that enters this radius will be detected and pursued, then what is the probability that a predator in a random location has prey in its radius?
(To clarify, if a predator has multiple prey in its radius, it will just pursue one. The only two states are pursuing prey or not seeing any)
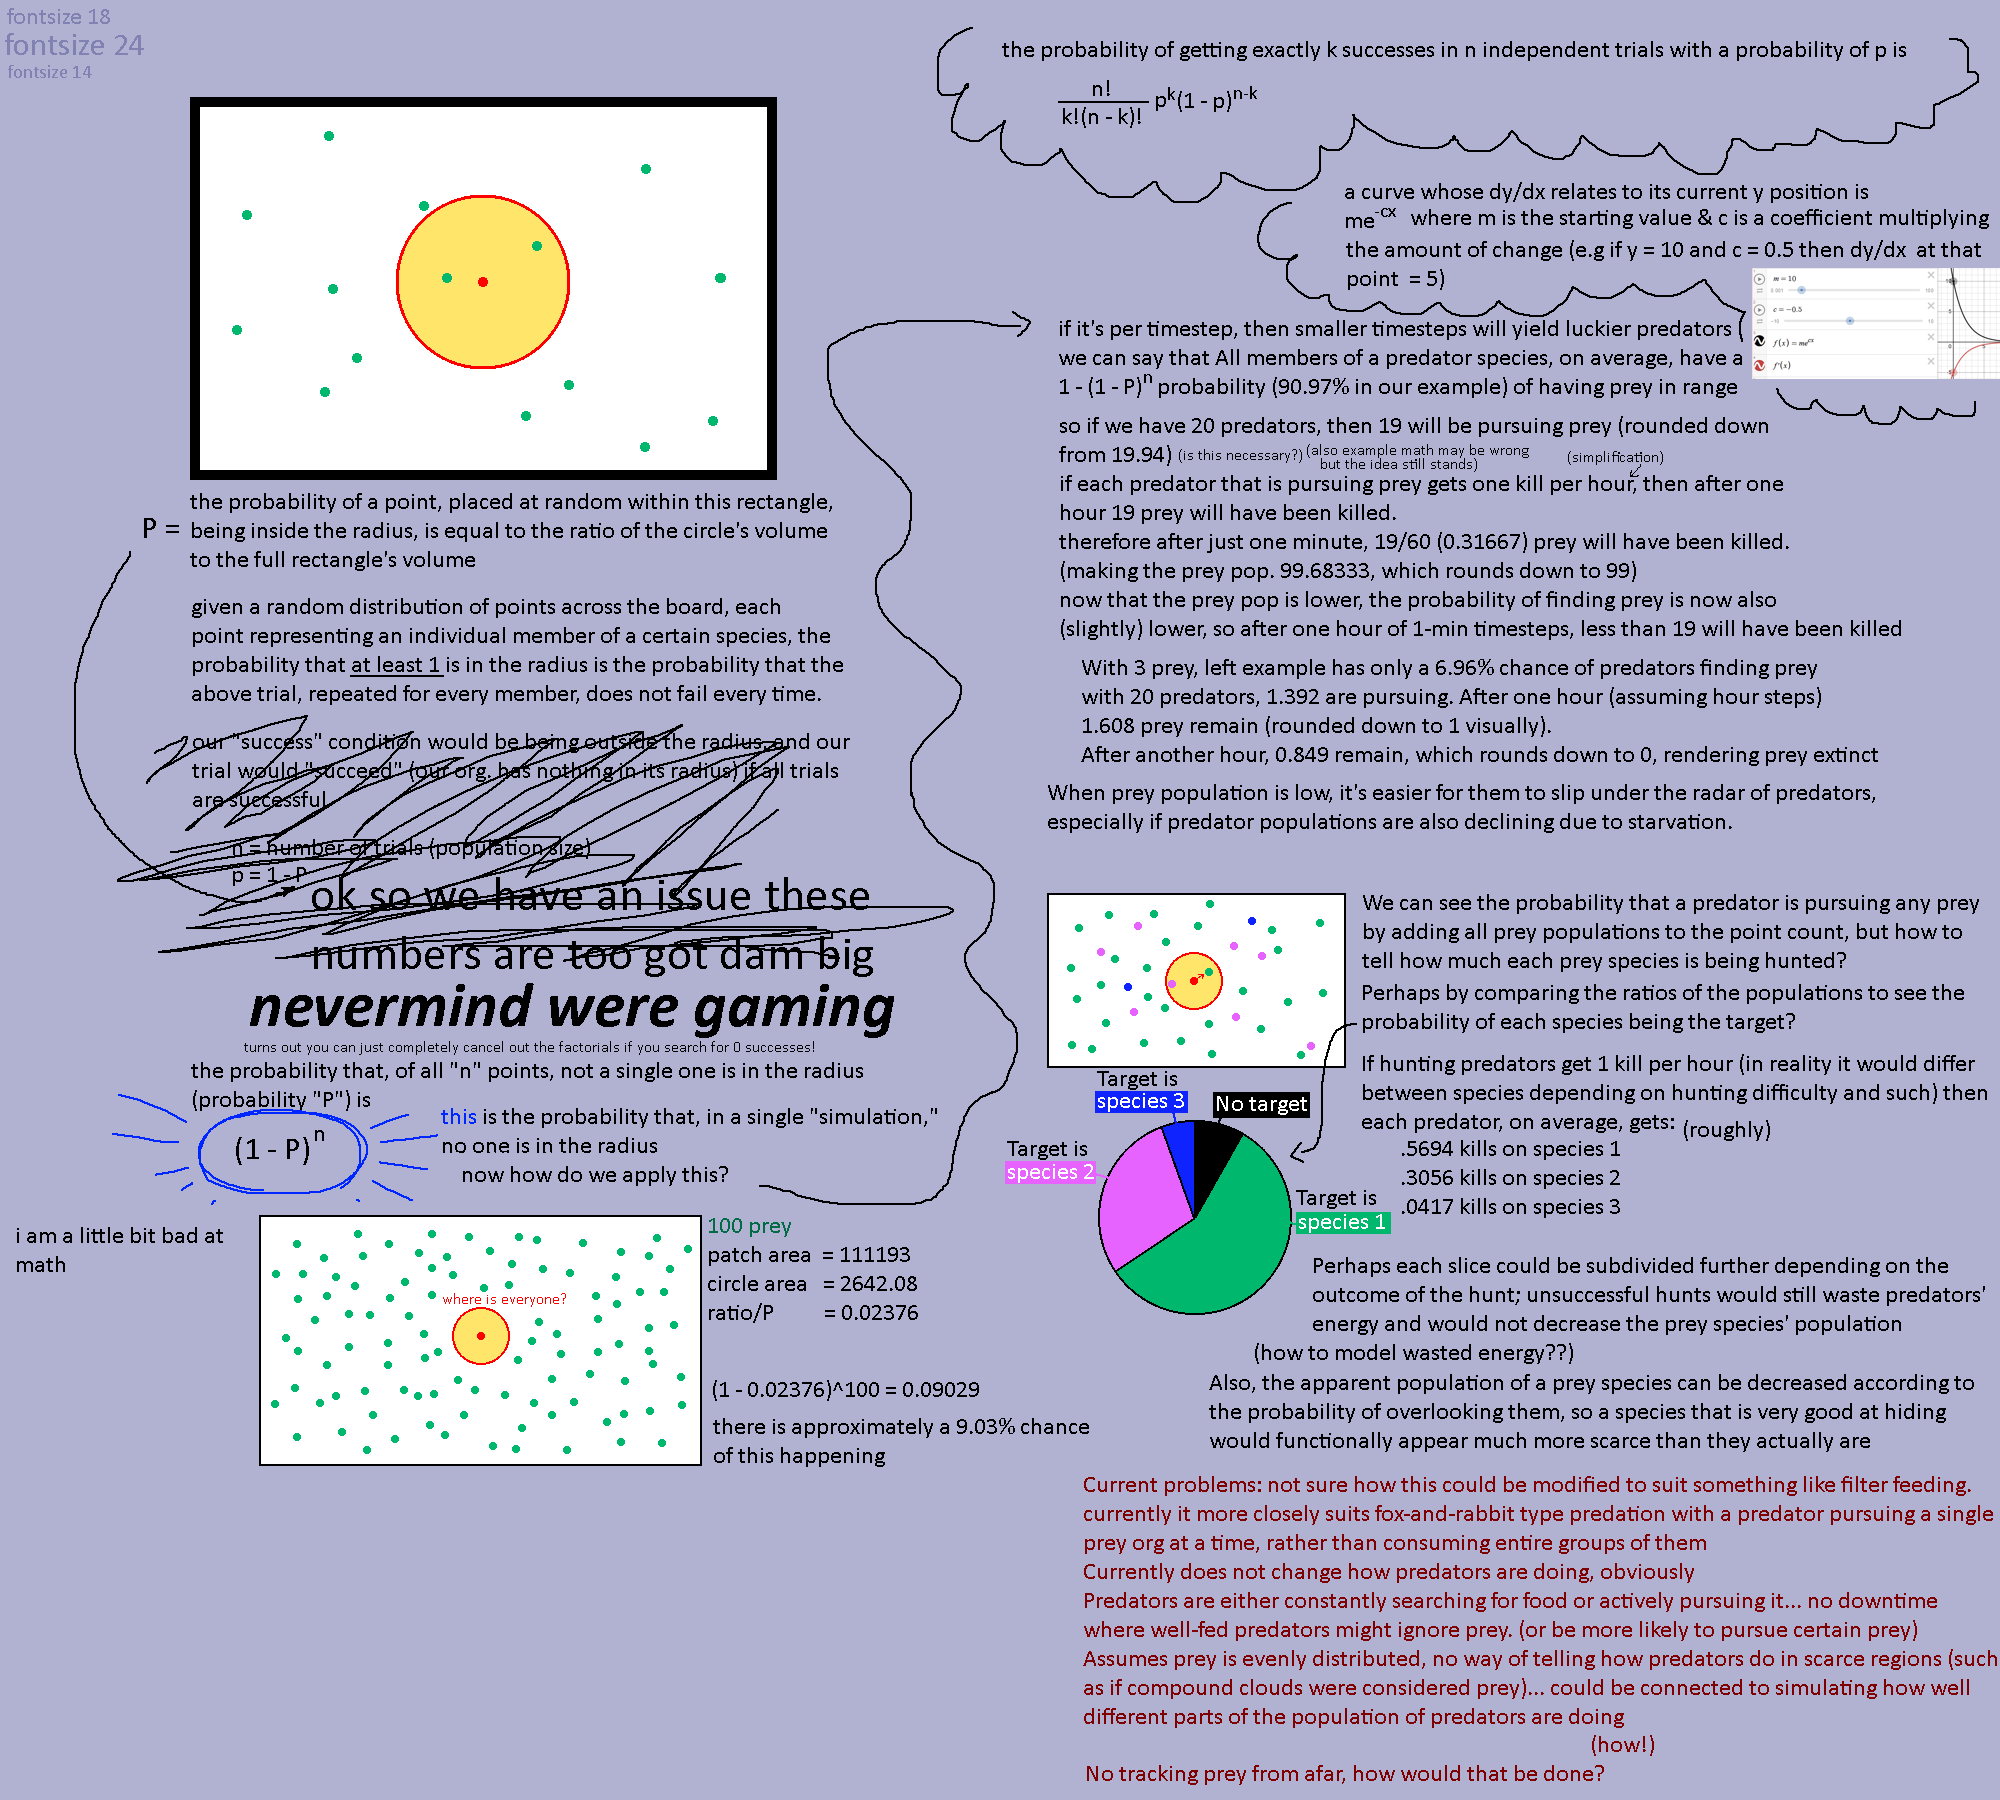
The probability that any point placed randomly will be in the radius = the circle’s area divided by the patch’s total area = P. If I want to find the probability of there being at least one point in the radius, then I need to find the probability that none of the prey points are inside the circle, which equals the probability of being outside the radius to the power of the prey’s total population. (or, (1 - P)^n, where n is the prey population)
Since prey is distributed throughout the patch randomly, we can say that it is the same no matter where the predator is located, and that it is the same for all predators located in the patch.
If we flip it (1 - ((1 - P)^n)) we get the probability that at least one prey org is within range of a predator, and we can use it to get the proportion of predators we can expect to be pursuing prey (realistically it’d vary, but in an infinite plane with the same prey density throughout, the probability of any predator having prey in its radius should be the same, so it’s a good average)
For example if the probability of seeing prey is 75%, and we have 250 predators, then we can say 187.5 predators have prey in range and will be actively pursuing it. Obviously it makes no sense to have half a predator be hunting, but using floats for these values will help, as I’ll explain with kill rates.
So if we say that each predator that is pursuing prey gets on average one kill per hour, then – if the timestep size is an hour – the prey population will decrease by exactly the number of hunting predators.
If the timestep size is smaller, then that decrease is adjusted to make sure it fits, e.g. if the timestep is a minute then that number would have to be divided by 60.
Now, assuming the predators’ population and overall status remains constant, prey is slightly more scarce, and thus a slightly smaller number of predators will be hunting it, and as the prey population gets smaller and smaller, the number of kills also gets smaller and smaller. This means prey can more easily slip under the radar if their population is low, especially if predators are also scarce due to starvation on their end.
Here’s where floats help – if 0.25 prey are killed each step, then it takes 4 steps for the prey population to decrease by a whole number.
In the UI, we can round down population numbers (e.g 2.7 to 2), and when a number falls below 1, we round it down to 0 and make that species extinct.
(Zoom in of part of previous image)
If we want a predator to prey on multiple species, then we can throw the populations of all those species into the random point pile, and again test the probability that at least one is the predator’s radius. Then, we divide that further according to the proportions of the populations to see what chances this point has of being each prey species. Then we can divide the kill rate between the species accordingly (though realistically kill rate would differ between species due to hunting difficulty and other factors)
e.g. if a species has a 25% chance of being encountered, then it gets 25% of the kills
Then consider how I could approach future stuff and think about the system’s shortcomings which I currently am not quite sure how I’d fix.
mmmmmmBuckets
An idea I’ve had for tracking statistics within a species’ population is to divide that population up into multiple buckets for each category. For instance, in a population of 100, 60 could be babies, 30 could be adults, and 10 could be Very Old.
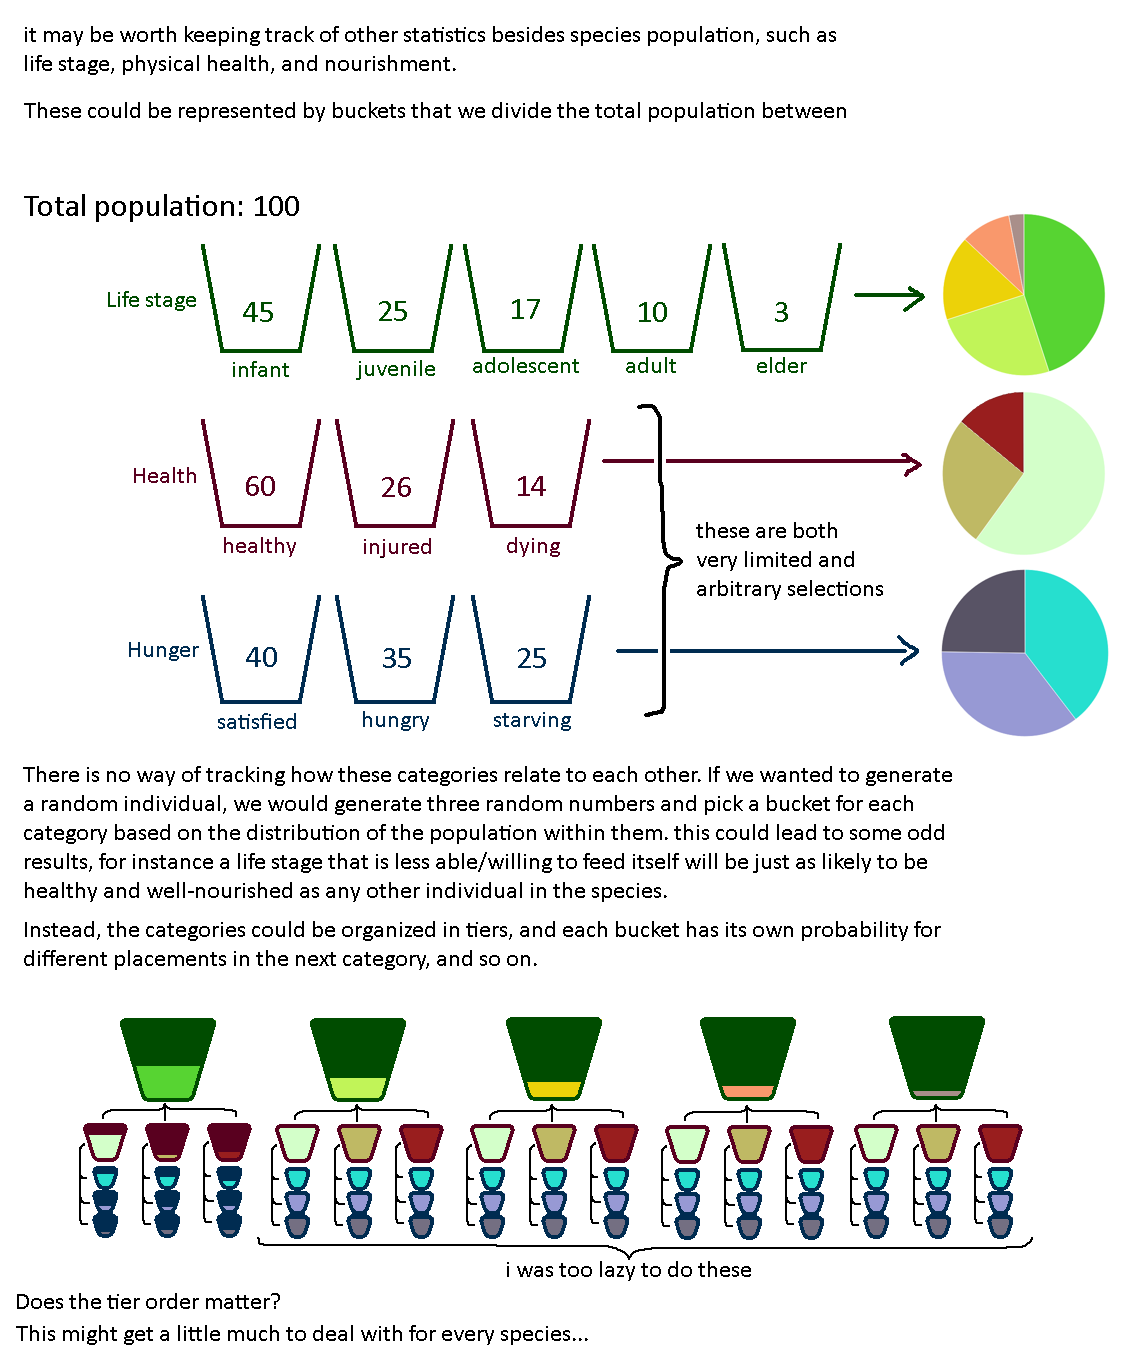
This could be used to keep track of differences in the population without straight up simulating every single member, and could also be used to spawn individuals in the physical game world that are more accurate to their simulated brethren.
However it’s hard to connect the categories together and see trends and correlations; when spawning an org you would have to just roll a random number for each category, and miss out on any correlation between age or caste and health or any other statistic. I considered a way to implement it but I’m guessing I should look into statistics a bit more because I’m not too sure right now