Part 7.1: Understanding Predation
We implemented a big feature in the previous part, but I’ll admit the write-up was a bit rushed. There was so much coding involved in updating the script that when it came to writing the post I was ready to just post it.
But I think it’s important that we fully understand this model as we progress through building it. So to better explain the additions we’ve made, let’s do a sub-part to illustrate how adding predation has changed the model.
Bugfixes
Before we begin, one bug I caught was that I realized I wasn’t using the predator’s adjusted speed in calculating the time per hunt or success rate for hunts. Recall that the predator’s adjusted speed is:
Predator Speed * (Predator Acceleration / Prey Acceleration)
Essentially giving them a bonus or malus to their speed based on how much acceleration they have relative to the predator. This bugfix has greatly improved the power of predators in the predator-prey relationships.
Overview
First thing’s first, let’s summarize what was done in the last part. Besides the under-the-hood changes I had to make to the code to support predation, all we did was make two changes.
-
Species can now predate on other species. This means that the fate of predators and prey are now getting tied together. If a predator does very well in hunting a prey, that could drive the prey to extinction, which would then cause the predator to go extinct. A predator would never want to over-hunt his prey.
-
When a species predates on another species, he compares his speed, endurance, and acceleration to those of the prey. The comparison determines the success rate of the predator in catching the prey.
It’s these two changes that lay the foundation for predation in the algorithm, and will be used as the basis for adding in future features like Prey Selection, Parasitism, Scavenging, and more.
Types of Hunters
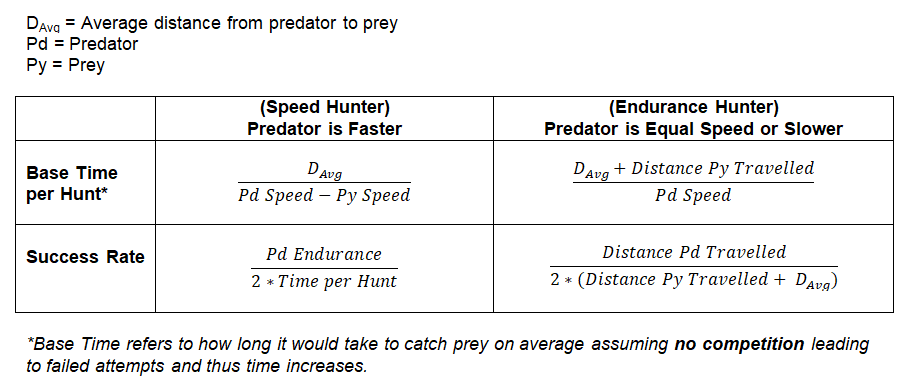
In order to create the equations we wanted, we categorized hunters into two types: Predators they are faster than their prey (Speed Predators), and predators that are not faster than their prey (Endurance Predators).
One change I’ve made here is that I’ve divided the outcome of the Speed Hunter success rates by 2. This is to represent the variability in hunting outcomes. Having an endurance that meets the average time per hunt likely won’t mean a predator will win 100% of hunts. In fact there will be a lot of variability with some hunts being shorter, some being longer, and only the average hunt having a length that is the average time per hunt. Thus it makes more sense if the predator’s endurance would actually have to be considerably higher than the average time per hunt to win 100% of them. With this change, they’ll need to have twice as much endurance.
The logic of this change was also applied to the success rate of Endurance Hunters.
Here’s a visual to represent these changes:
Problems with the “2 Types of Hunters” System
There is one problem I’ve noticed that this system introduces however. Since Speed Hunters and Endurance Hunters have their outcomes calculated differently, just a slight change in a predator’s speed can make it suddenly shift categories and dramatically change its survival. Sometimes, if the conditions are in a certain way, a predator actually performs WORSE by increasing their speed, since they switch from being an endurance hunter to being a speed hunter and the calculations give them a lower success rate. There are two ways I can think of to solve this:
- Hunting Spectrum. Make the hunter type a spectrum. Instead of a species being 100% a Speed Hunter or 100% an Endurance Hunter, we can allow for a range of combinations in between. Since we’re dealing with average speeds, average success rates, etc., we can say that on AVERAGE the species uses Speed Hunting X% of the time and uses Endurance Hunting Y% of the time.
- Fall-Back Option. Make Speed Hunters able to fall back to using Endurance Hunting if it gives them better success rates.
I ended up implementing both of these. I liked the idea of a Hunting Spectrum, because I didn’t like the sudden jump species were making from one category to another the moment their speed went a little higher than the prey. At the moment, if the predator’s speed is equal to or lower than the speed of the prey, he will use Endurance Hunting 100% of the time. If his speed is 50% higher than that of the prey, he will use Speed Hunting 50% of the time. If his speed is double that of the prey or higher, he will use Speed Hunting 100% of the time.
I also liked the idea of a Fall-Back option because it doesn’t make sense why improving speed should decrease the success of a predator. This now means that endurance hunting is the “default” for species, and evolving a higher speed than your prey simply offers you the option of using speed hunting if its more effective. I will have to do further research into why speed hunting often gives worse performance though.
Tying into the Algorithm
How does the addition of predation affect the overall process of hunting, acquiring food, and starvation deaths?
Predation simply adds an extra limiting step in the process of hunting. Recall that when we added food to the system, it introduced the ability for species members to die of starvation if not enough energy was consumed. Well since then we’ve been gradually increasing the possible factors that can cause a species to not get all the energy it needs, ultimately increasing the importance of Starvation Deaths. Implementing movement in part 3 introduced the idea of having to spend time to reach food, competition led to increases to time based on how many people were chasing the same food, and now predation adds the ability for prey to escape you if you are not fast enough. Since we’ve now added so many factors, let’s summarize the full “Hunting Breakdown” of all the steps that limit the success of energy consumption:
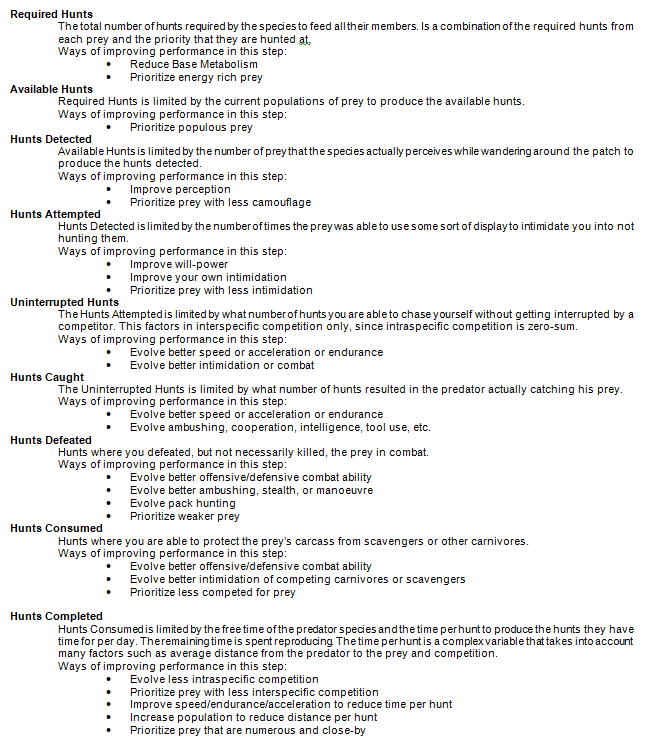
First a species determines how much total energy it needs and it divides it up into quotas between each prey based on how much it prioritizes that prey. This is used to calculate the Required Hunts for each prey. However, a species might require more hunts than there are prey, so required hunts is limited to produce the Available Hunts. However, an organism has to compete with other species and even members of his own species who could steal a prey before him, so the available hunts is limited by competition to produce the Uninterrupted Hunts. However, an organism may not always catch all the prey he chases if they are able to evade him, so the uninterrupted hunts is limited to produce the Caught Hunts (this is the step added by predation). Finally, the organism might not even have enough time in the day to perform the number of hunts he needs to feed himself, so the caught hunts is limited by the organism’s free time to produce the Completed Hunts. This final completed hunts value is what determines how much energy the species gets from that prey, and is used to calculate Starvation Deaths.
That was a big wall of text, so here is a visual:
In this diagram I focused on energy instead of hunts but it’s the same idea.
Think of the width of the bars representing the amount of energy at each step. The main pattern you can see is that each step reduces the final success rate of the species in getting the energy they need. The boxes to the right explain the limiting factors involved in that step. We can see that the amount of energy a species actually receives will almost always, without exception, be less than the ideal amount of energy they would need in a perfect world. That might not be entirely the case right now, but it will become more and more true as we continue to flesh out the algorithm.
This means species have many opportunities in evolution to better adapt to any one of the numerous limiting factors that are listed on the right-hand side. A good player will be one who can easily identify the factors that are limiting his hunting the most and plan what mutations would best respond to that for the short and long term.
For those who are interested, here is a sneak peek at a more expanded version of the “Hunting Breakdown” list. This is what it will look like once we’ve added more features to the algorithm (like perception and combat).
Order of Calculations
Before we move on to the final topic, I’d like to reiterate one more time how the order of calculations has been changed with the addition of predation. Here is a visual:

Predation and Starvation are calculated simultaneously. This means if a species has 100 members who require 100J of energy, but they only receive 50J, then 50 members die of starvation (assuming a starvation penalty of 100%). If 25 members are eaten by predators, this is further subtraced out of the remaining 50 members to leave 25 surviving members as the Intermediary Population 1.
This means that those 25 members who were eaten by predators still contributed towards starvation. What if all 25 of those members died at the beginning of the month? Shouldn’t the species have only suffered half as much starvation because it really only had to feed 75 mouths? Or what if the 50 members had died of starvation first? Then wouldn’t the predators have had a harder time finding the remaining 50 members and perhaps only eaten 15 of them instead of 25? This approach ignores all those possibilities and just has both starvation and predation occur at the same time.
I’m describing this again in case someone can find a flaw with this approach. I am worried that it is sacrificing some realism, but the alternatives were just far too complex and seemed to sacrifice even more realism. If you try to calculate predation first sometimes, you need to calculate starvation first other times to be realistic. You also then need to decide which species to calculate predation on first sometimes and which species to calculate predation on first other times. It becomes a whole Belgiuming mess, so “Simultaneous Calculation” was the best compromise I could think of.
Performance Stats and Traits
Now finally, we’ve explained what the changes were by adding predation into the model, and we’ve explained how these additions affected the rest of the model. But let’s take a look at a very significant but underappreciated feature that was added way back in Part 1, statistics!
We’ve been gradually piling up the number of Performance Stats and Traits in the game. It might get kind of easy to lose track of all of them. The “Starting Conditions” boxes have become pretty sizable with multiple images, and the Charts are so big now with so many Performance Stats I won’t always be posting them.
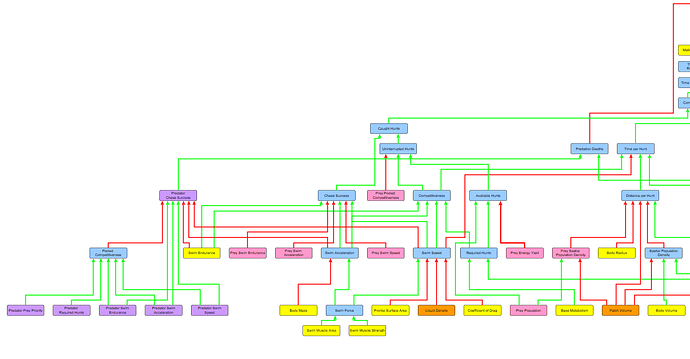
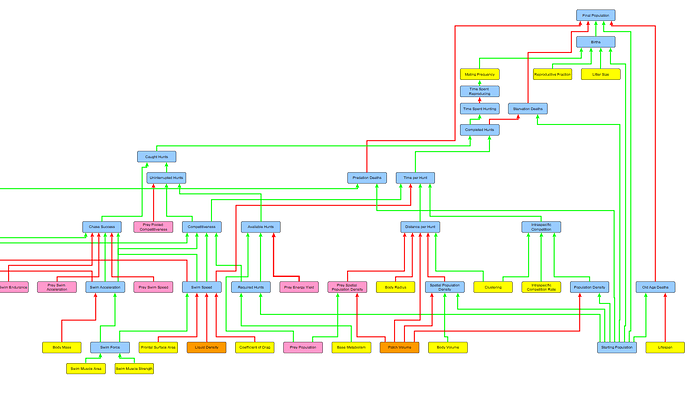
So in the interest of seeing how all the statistics tie together, and also cause it’s pretty cool, let’s make a tree of all the relationships between all of the traits and performance stats!
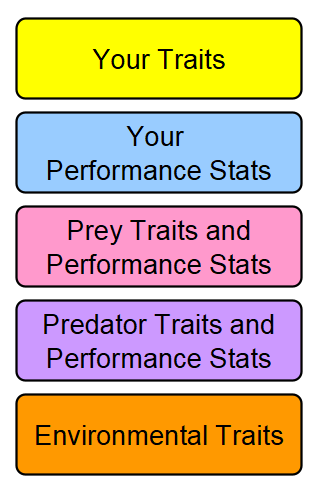
Legend:
- Yellow boxes are Traits of the current species.
- Blue boxes are Performance Stats of the current species.
- Pink boxes are Traits or Performance Stats of any prey of the current species.
- Purple boxes are Traits or Performance Stats of any predator of the current species.
- Orange boxes are Traits of the environment.
- Green arrows show proportional relationships (where an increase in the source leads to an increase in the target)
- Red arrows show inversely proportional relationships (where an increase in the source leads to a decrease in the target)
Although the diagram can seem overwhelming at first, it actually contains a lot of cool information. For one thing, it contains all the current traits and performance stats in the model. Also, since it tells you what is calculated from what, it also essentially shows you the order of calculations!
The presence of pink and purple boxes on the chart representing stats from prey and predators show how the addition of predation has made species success a lot more dependent on the success of its prey and predators.
Orange boxes represent the features of the environment. Those boxes are the potential targets for change during climactic events like ice ages or global warming, and those variables will change when a species moves to a new biome. At the moment, the number of orange boxes is pretty limited. This will change as we introduce more features of the environment in future parts.
Another cool thing is that the yellow boxes represent all the potential targets for evolution for your species. These variables are the ones that will only change as a result of changes you make in the Organism Editor. They essentially represent the player’s input into the system. It’s through the manipulation of the yellow variables that the player tries to increase the survival and success of his species on his planet. In Episode 3 we will talk about how these Traits are derived from the designs of organisms the player makes in the Organism Editor.
Conclusion
That’s it for this sub-part! Thanks for reading, and hopefully this helped shed light on the recent changes to the system from adding Predation. Stay tuned to see what will be the topic for the next part, but I sense that it will be something interesting.
