Ok here’s some thoughts of my own, I have few ideas in terms of implementation I’m afraid but hopefully it’s still helpful in some way.
All/Full Concepts
Sunlight availability (that’s right it’s another desmos calculator)
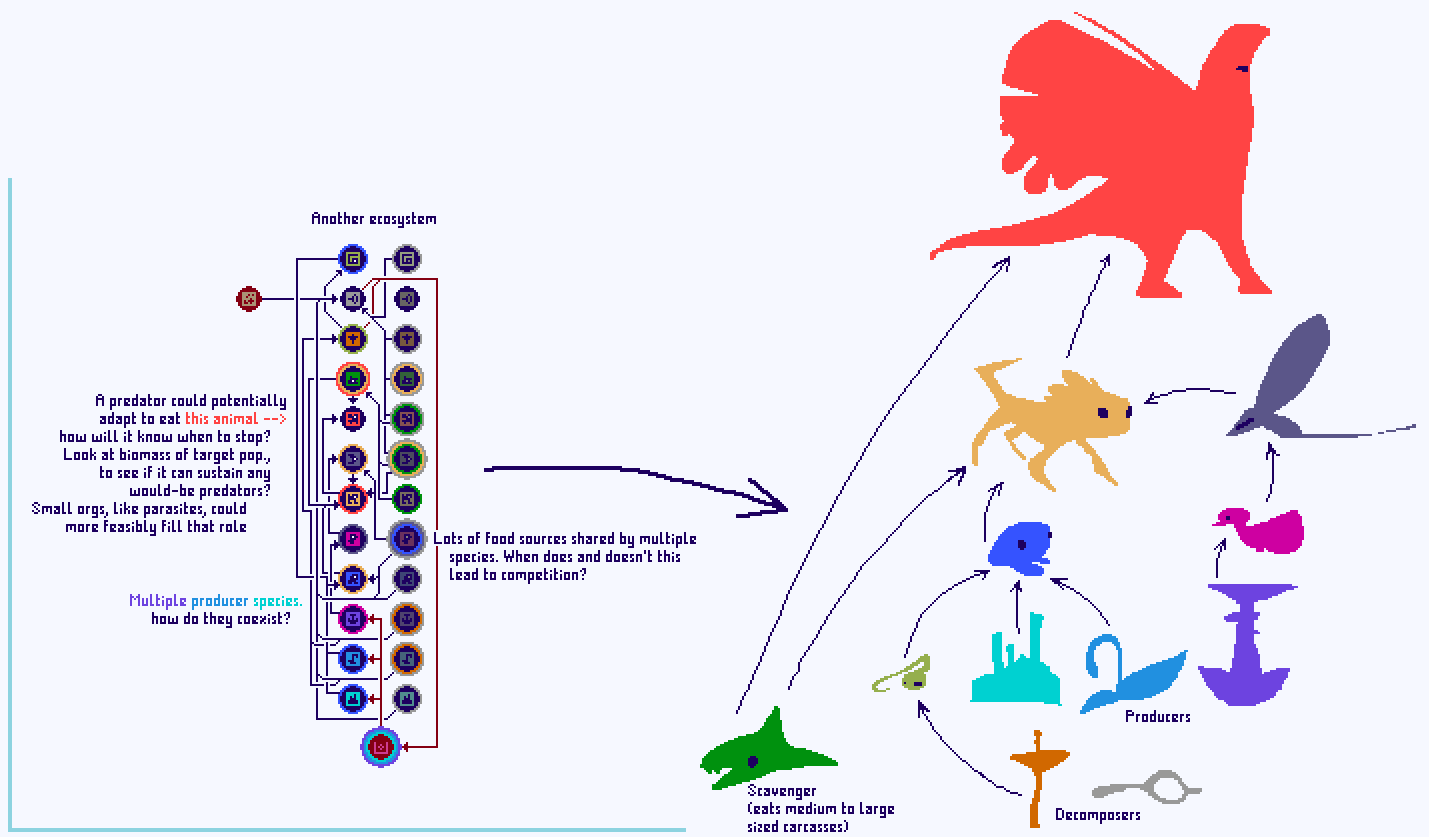
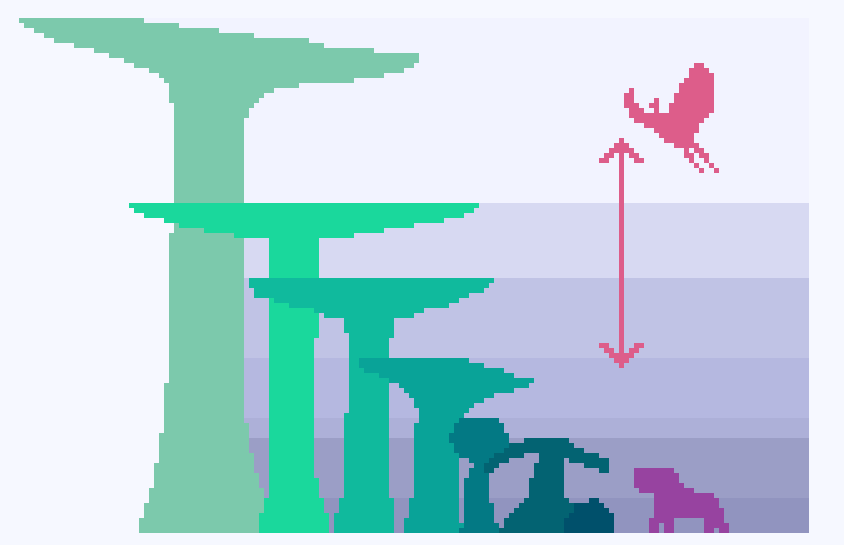
Not much to see here (besides some cool creature silhouettes i guess)
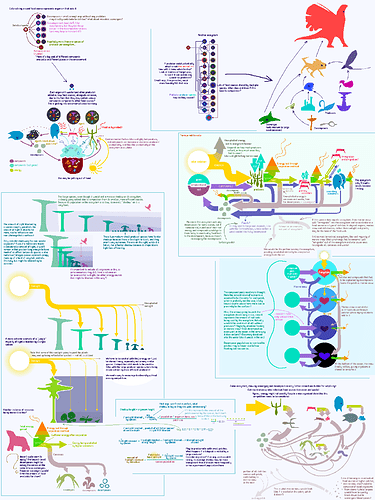
These are some pretty basic (and bad) representations of food webs, defined only by colored rings around certain species that represent which species are preying upon them, without any regard for the nuances of how different predators would prey on the same organism, and how they may or may not compete.
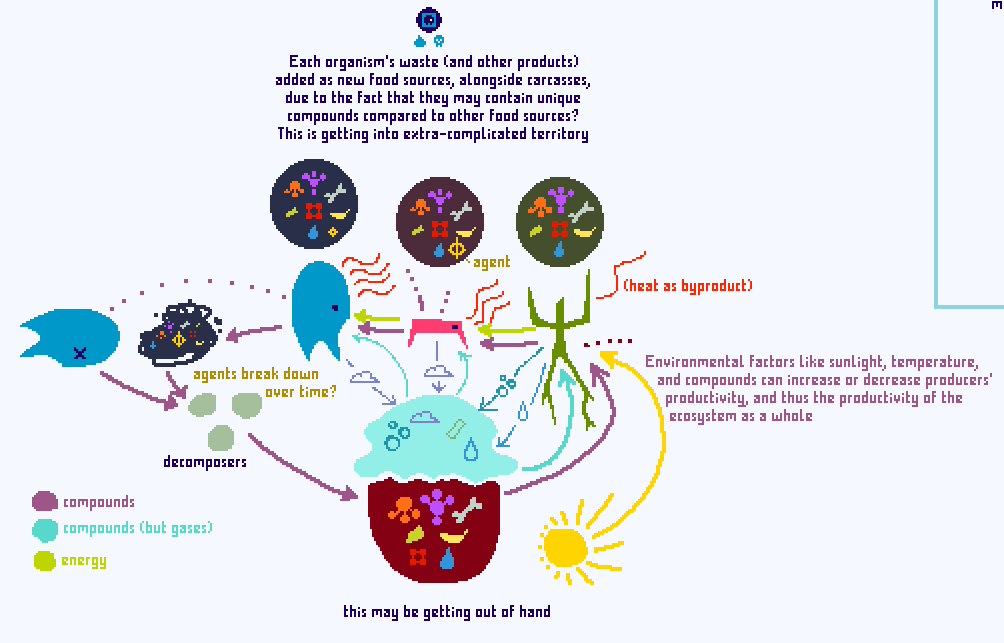
Here I get into some ideas on nutrient/compound flow. This patch has certain amounts of different compounds both in the soil and the air, which are then stored in the producers who use them to grow, and then in the consumers who eat them, and so on. The energy produced by producers can only go so far and dies with the apex predators, while the flow of nutrients is fully cyclical: every organism here “creates” extra food sources for carcasses and (if applicable) waste, however only the blue apex predator’s is shown due to lack of space in this totally cramped diagram. Carcasses and waste would be eaten by decomposers, cycling the compounds back into the environment.
I also wondered how agents would be treated, and assumed they would just break down (during decomposition?) instead of endlessly bioaccumulating.
I quickly decide I’m getting ahead of myself, before immediately pursuing the idea further.
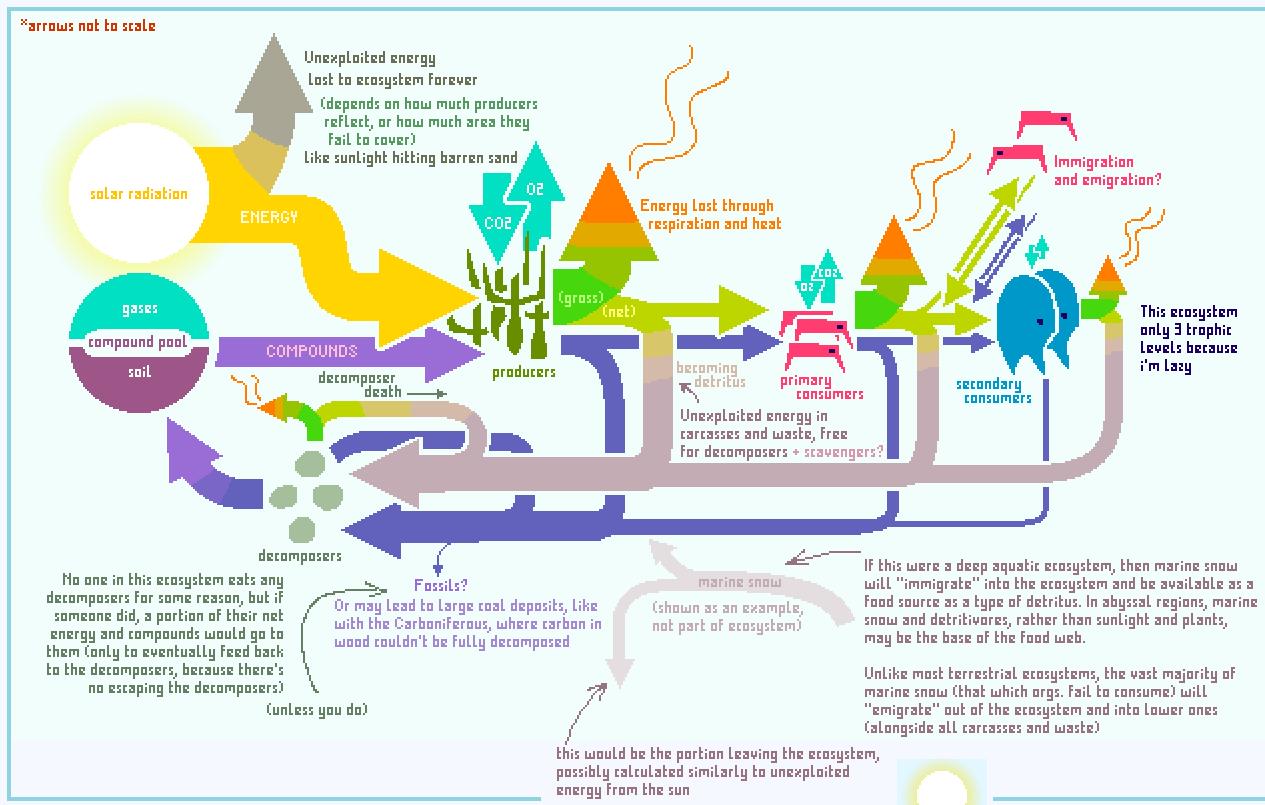
The cycle starts at the sun. Each patch has a total input amount of sunlight, representing how much light hits the entire surface of the patch in total. Some of this energy is harnessed by producers in the patch, based on their number, size, and how much light they reflect/absorb. The remainder is lost, either hitting non-productive parts of the ecosystem (like barren soil or a non-producer) or being reflected by producers.
Our producers take in sunlight, as well as vital compounds from the compound pool, both from the soil and the air. A majority of their gross energy intake is used up in respiration and lost through heat (forest green arrow turning red), while some of the net energy (lime green arrows) remains unexploited in detritus (lime green turning beige – the color may be misleading, these arrows still hold energy!), either in waste left by the organism due to imperfect digestion of material, or carcasses of the organism itself. (Detritus may be a confusing word for what I’m referring to, though I heard it technically applies?)
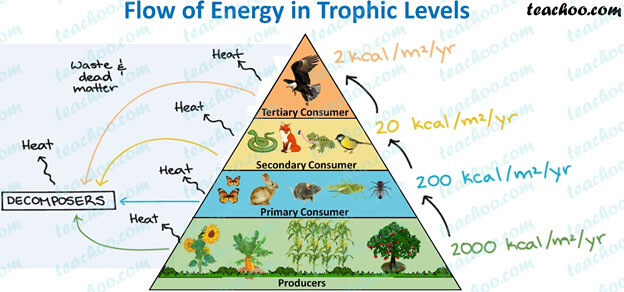
The remainder of that, probably about 10% of the input, is free for predators to consume, and this becomes their gross energy intake, and so on.
Note how the energy and compounds arrows are almost always paired together past the producers, as consuming any organic food source will also grant the consumer the nutrients present in it.
Nothing consumes living apex predators, so all of its net energy becomes detritus, which accumulates with the detritus of all other species in this patch, alongside it and the others’ compounds, which all goes straight to the decomposers. Nothing eats the decomposers in this patch, so all of their energy that isn’t lost as heat turns into detritus, which feeds into the total detritus pool, eventually cycling back to them.
Also note the transparent detritus arrows representing marine snow, if it existed in this patch (which it doesn’t). It comes in, some of it is able to be utilized, and the rest disappears (into another patch!)
Please note the incompleteness of this concept! It only represents a limited food chain, and I haven’t considered how things might work with a full food web. Also note the lack of any scavengers whatsoever.
Also there may be multiple, more specialized decomposers rather than one species that eats everything, however they should be quick to evolve to take advantage of any unexploited detritus, leaving hopefully nothing undecomposed in most developed ecosystems
I haven’t thought about what might happen if no decomposers exist in an environment. Nutrients in the soil may slowly be drained. (though how soil got there without decomposers in the first place is a bit questionable – see the “ecosystem formation” section in my previous post)…Would concentrations disappear over the course of several generations? Would the effects of this infertility start to take effect as soon as the generation where producers take root in the environment?
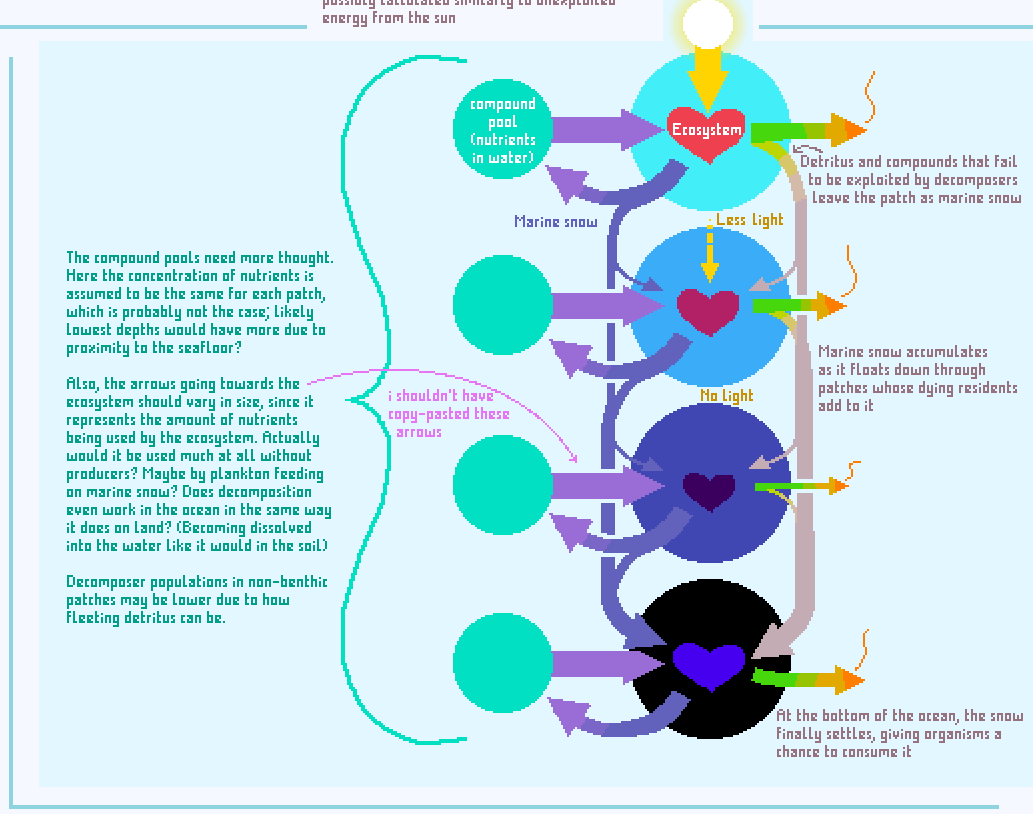
Here’s a multi-patch view of the movement of marine snow! Its ideas are similar to the previous diagram, except now each colored circle represents a patch, and the heart, its entire ecosystem.
The Epipelagic (topmost patch) is by far the most productive patch, producing the vast majority of the energy used in this water column, with the dim Mesopelagic just below it being a very distant second.
(The producers in) its ecosystem take in sunlight and compounds dissolved in the water (from the compound pool – same idea as last time, just with no soil). Most of the energy and compounds in the ecosystem flow normally, like shown earlier – most of it is lost as heat, the rest goes through its food web until reaching the apex predators, and most of the detritus is consumed by decomposers (and scavengers!), its compounds cycled back into the environment.
However, some of this detritus gets loose, represented by the compound and detritus arrows (purple and beige) splitting off and heading down into the Mesopelagic.
The Mesopelagic produces some of its own energy from the remaining sunlight, but it also gets a very small amount of its energy from some of the marine snow dropping down from above while their waste contributes to the remainder.
The Bathypelagic patch below it is unable to produce any energy, however it is still unable to sustain some life due to having even more marine snow than the Mesopelagic patch had to work with.
Finally, the Abyssopelagic floor patch is no different in terms of energy production, however it is different in that the detritus has no lower patches to escape to, giving detritivores and bottom feeders plenty of opportunity to consume all the marine snow that arrives in their patch.
As noted in the concept (along some questions about aquatic decomposition) it was kinda stupid of me to copy and paste the compound pool and compounds arrows for each patch. The arrow going to the lower ecosystems should’ve been smaller as there’s less life to use dissolved compounds, and in turn less compounds to recycle back into the water and less to lose as marine snow.
(Also, should the Abyssopelagic floor patch’s compound pool have a “soil” section? Where would decomposers recycle the compounds to? The water? The seafloor? A bit of both?)
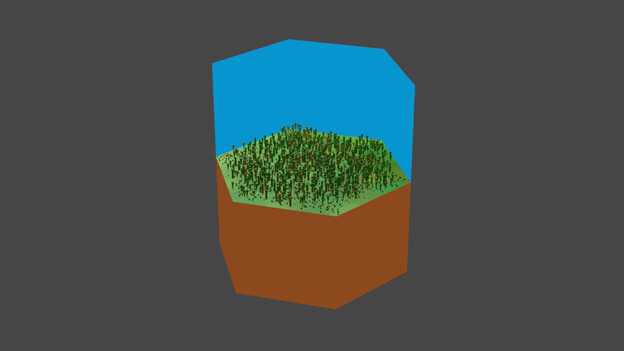
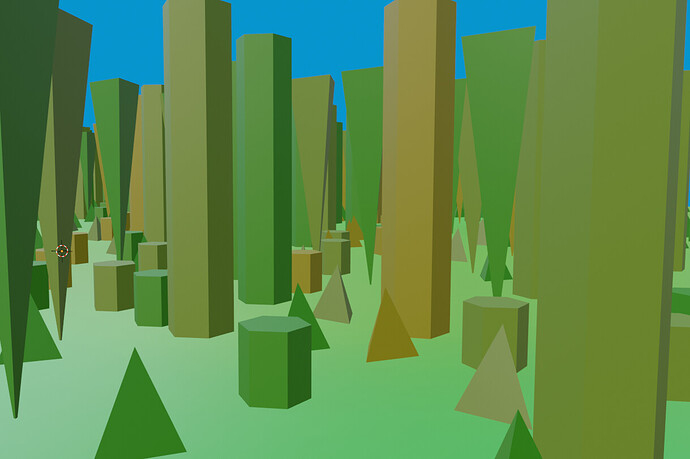
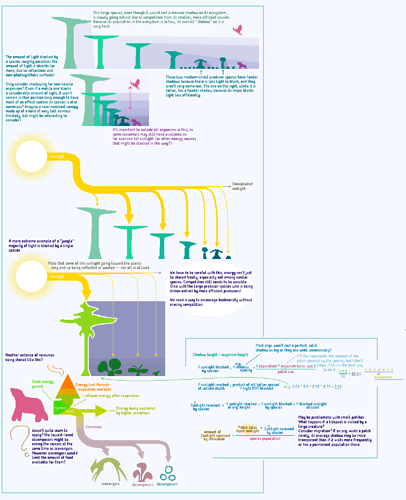
Here’s some ideas on how producers in a “forest” ecosystem might compete for light. Each species casts a “shadow” on its environment, and the extent of that shadow depends on the species’ height, while its opacity depends on the species’ population and how effective it is at blocking light.
For instance, even though the first producer in my first “forest” (looks like a tall, desaturated, crooked “T”) is by far the tallest of them all, the shadow it casts is extremely weak because its population is very low.
(Total shadow opacity by height. Note the tall producer’s very faint shadow.)
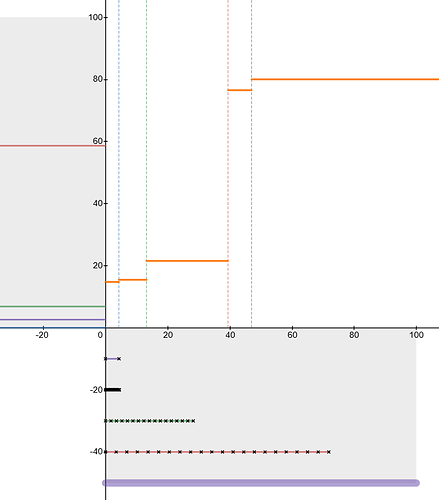
I made a visual calculator (yes, it’s another desmos thing i spent way too much time polishing) for the availability of sunlight throughout a patch
here.
The upper-right quadrant shows how the available energy from sunlight (y axis) changes as you increase your distance from the ground (x axis). Note the vertical dotted lines dividing the changes in sunlight intensity, color-coded to represent different species’ shadows.
The upper-left quadrant shows the percentage of the total input sunlight each species takes in.
The bottom-right quadrant shows the horizontal size of each organism compared to the patch’s land area, which together calculate the amount of light blocked by a certain species.
The blocking of light is also directly tied to the amount of sunlight a species gets in total.
Shaded regions of the patch could help to spawn new niches adapted for lower levels of sunlight. For instance, if a single lone producer species somehow grew tall and blanketed most of its ecosystem, there would still be an unexploited energy source in the dim sunlight slipping through the canopy, and thus niches waiting to be filled.
I thought maybe this pattern of energy being used in a “hierarchical” order could also be used to model how much energy consumers get from shared food sources, but it’s too orderly and doesn’t reflect competition whatsoever.
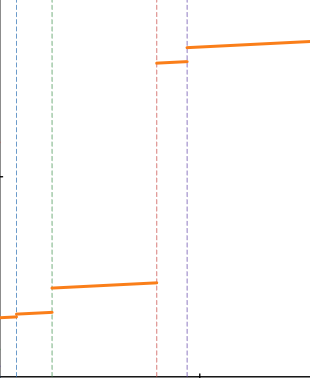
Finally I thought a bit about “animals” casting shadows too, which seems weird but I considered it for the sake of keeping our mechanics non-earth-centric, Just In Case. Just imagine a dense, massive herd of colossal beasts slowly lumbering across the continent – they’d definitely have an impact on the light levels of most biomes. Most producers would have to adapt to a constantly dimmer lifestyle, but some may take the challenge and attempt to grow so tall they tower over even the massive animals.
(Shadows would have to become less opaque as you get higher up in order to incentivize doing so for NPCs, so the sunlight availability graph might actually look something like this:)
Back to nutrient/energy flow!
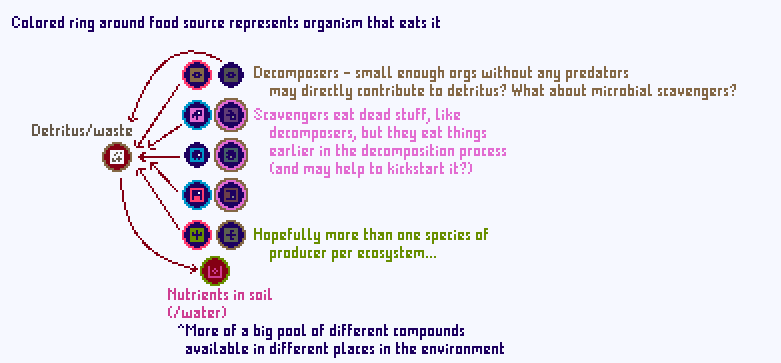
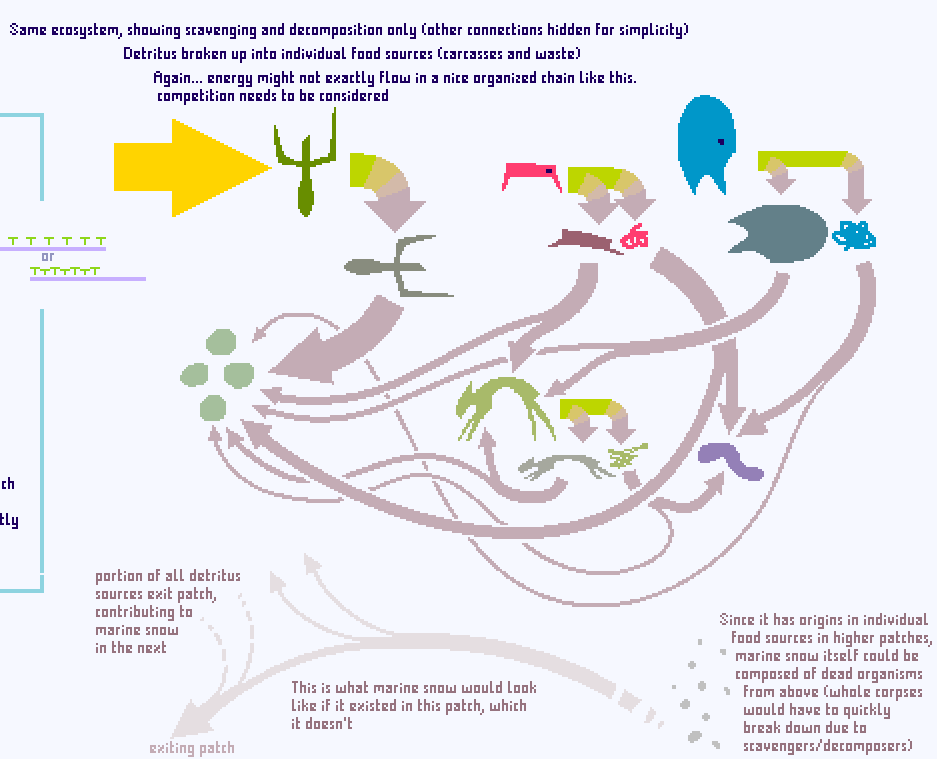
I added some extra eaters-of-dead-stuff to our ecosystem from before: A scavenger (lanky greenish-yellow animal) that eats carcasses (but not dead plants) and a worm that eats poop.
Here, I broke down all the different forms of detritus into unique food sources, rather than treating it as just one. (Except I’m just now realizing that the fecavorous worm doesn’t have any, so let’s just say it’s immortal)
This allows different species to take advantage of largely different detritus sources, rather than having everything going to one decomposer species – now just some of everything is going to them. Again, I haven’t taken competition for shared food sources into account yet!
I also showed what marine snow would look like if it existed in this patch (it does not) – maybe even it too could be composed of different detritus sources, from small flakes to mostly-intact carcasses from above, like dead whales drifting to the bottom of the ocean.
That’s it for that big clump of concepts, but I still have another image made in an entirely different graphics program to get through:
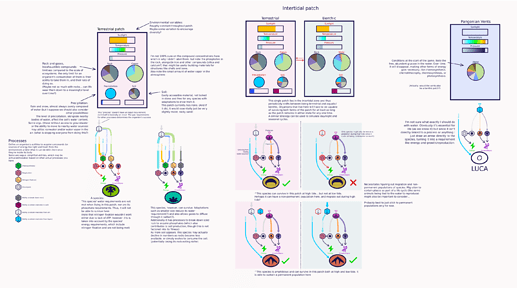
I was intending to do a step-by-step demonstration of how life could colonize a barren niche, but I feel like I’m still missing a lot of pieces.
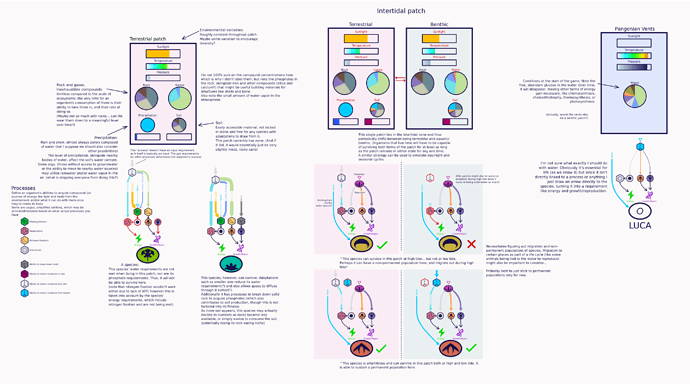
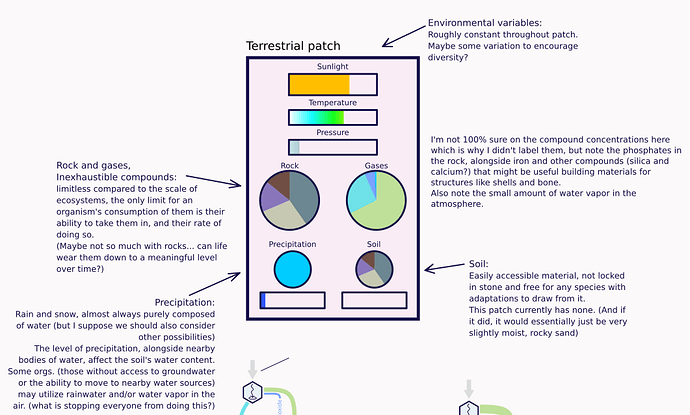
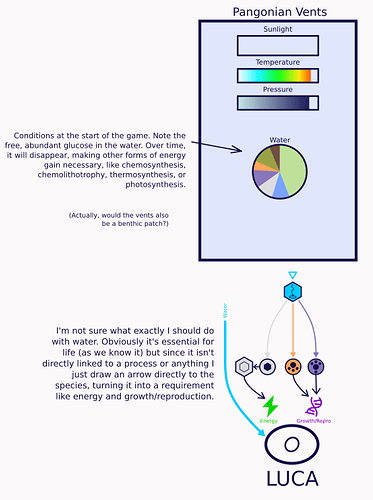
I start with a patch and define all its abiotic variables. Sunlight, temperature, and pressure should all be self-explanatory. However I fleshed out the compound pool idea a little more here: patches have “inexhaustible compounds,” which now that I’m thinking about it is a very inaccurate name. It includes the gases in the air (or water) and the minerals in the rock (only if your patch has land, mid-ocean patches just have water). Though their composition may be harder to change than that of soil, it is entirely possible for life to have an effect on them, especially gases (like what happened with the great oxygenation event, or is planned to happen with all the glucose in the vents)
Additionally, terrestrial patches may have a soil layer, which, if it exists at all, may just start out as the same minerals in the rock, however life may help to make it fertile over time. Precipitation also exists, which I’m still not too sure about.
This patch has no soil and very little water precipitation.
Now that we know the patch’s conditions, we know what sort of life can and can’t live there.
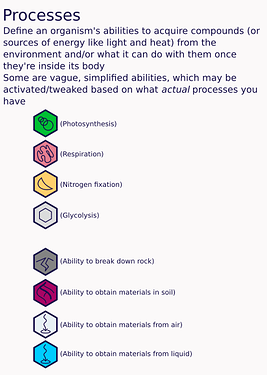
First, a helpful key:
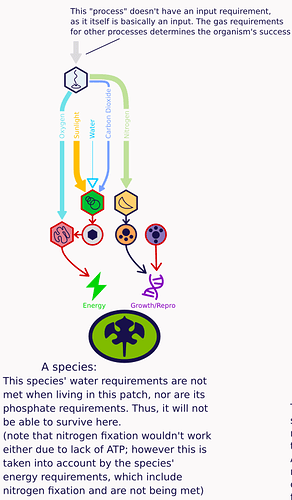
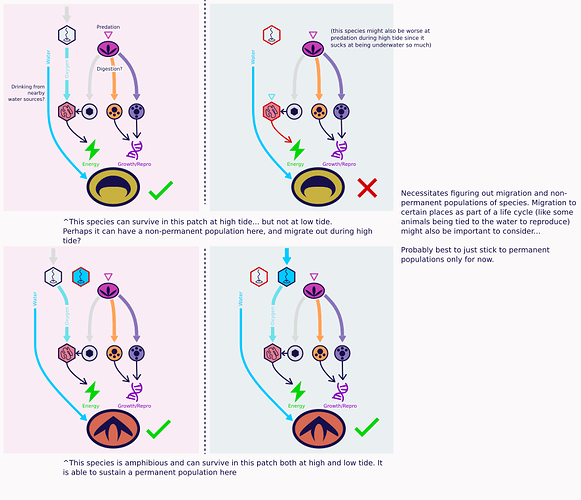
The colored arrows represent compounds (or energy sources) flowing into various processes. The size of the arrowhead/triangle represents the amount required for the process to sustain the organism properly, while the thickness of the line before it represents the amount the organism is able to get from the patch. A hollow arrowhead means a process requirement isn’t being met, as do the red outlines and arrows. (I switch from one to the other kinda arbitrarily, sorry)
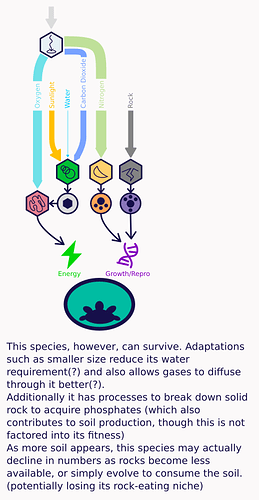
This species is better adapted to this patch due to its low water requirement and ability to break down rock for important compounds (and could be likened to lichen)
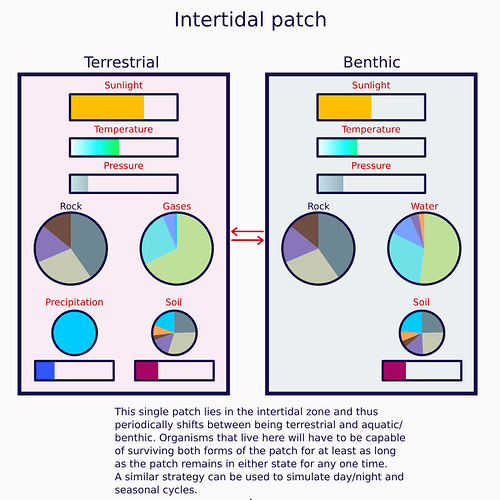
There may be situations where a patch’s conditions aren’t always constant, however. This patch lying in the intertidal zone is a good example, but the same idea could be used to account for differences between day and night, and all sorts of other different “states” of a patch.
This patch is underwater half the time, so it periodically switches between being terrestrial and aquatic (+benthic, because it includes a floor). Note how the variables change, and how gases are replaced by water and vice versa.
In order for a species to survive here, it will have to be able to survive in both versions of the patch. (At least for as long as the patch remains in one state for any one time. So holding your breath for 6 hours if you can’t breathe underwater is technically a viable strategy)
A comparison between two species, and how either fares in both the terrestrial state (left) and the aquatic state (right). Note how the bottom one is able to effectively extract necessary gases from both the water and the air.
Finally, here’s our very first patch and our very first species. Normally, ecosystems need to be fueled by producers adapted to converting things like sunlight or certain compounds into energy, but very early game, the vent patch will have massive amounts of glucose, essentially the (other) currency of energy, free for all sorts of species to take in and convert into ATP through glycolysis or respiration. This might actually discourage autotrophy for a few generations, as seeking out unique energy sources in order to produce a compound that’s already freely floating around might be suboptimal compared to floating around and basking in the free energy. However as the levels of glucose drop, species will have to adapt to survive their new environment; some will become producers, and those that don’t will either go extinct or learn to eat the producers.
